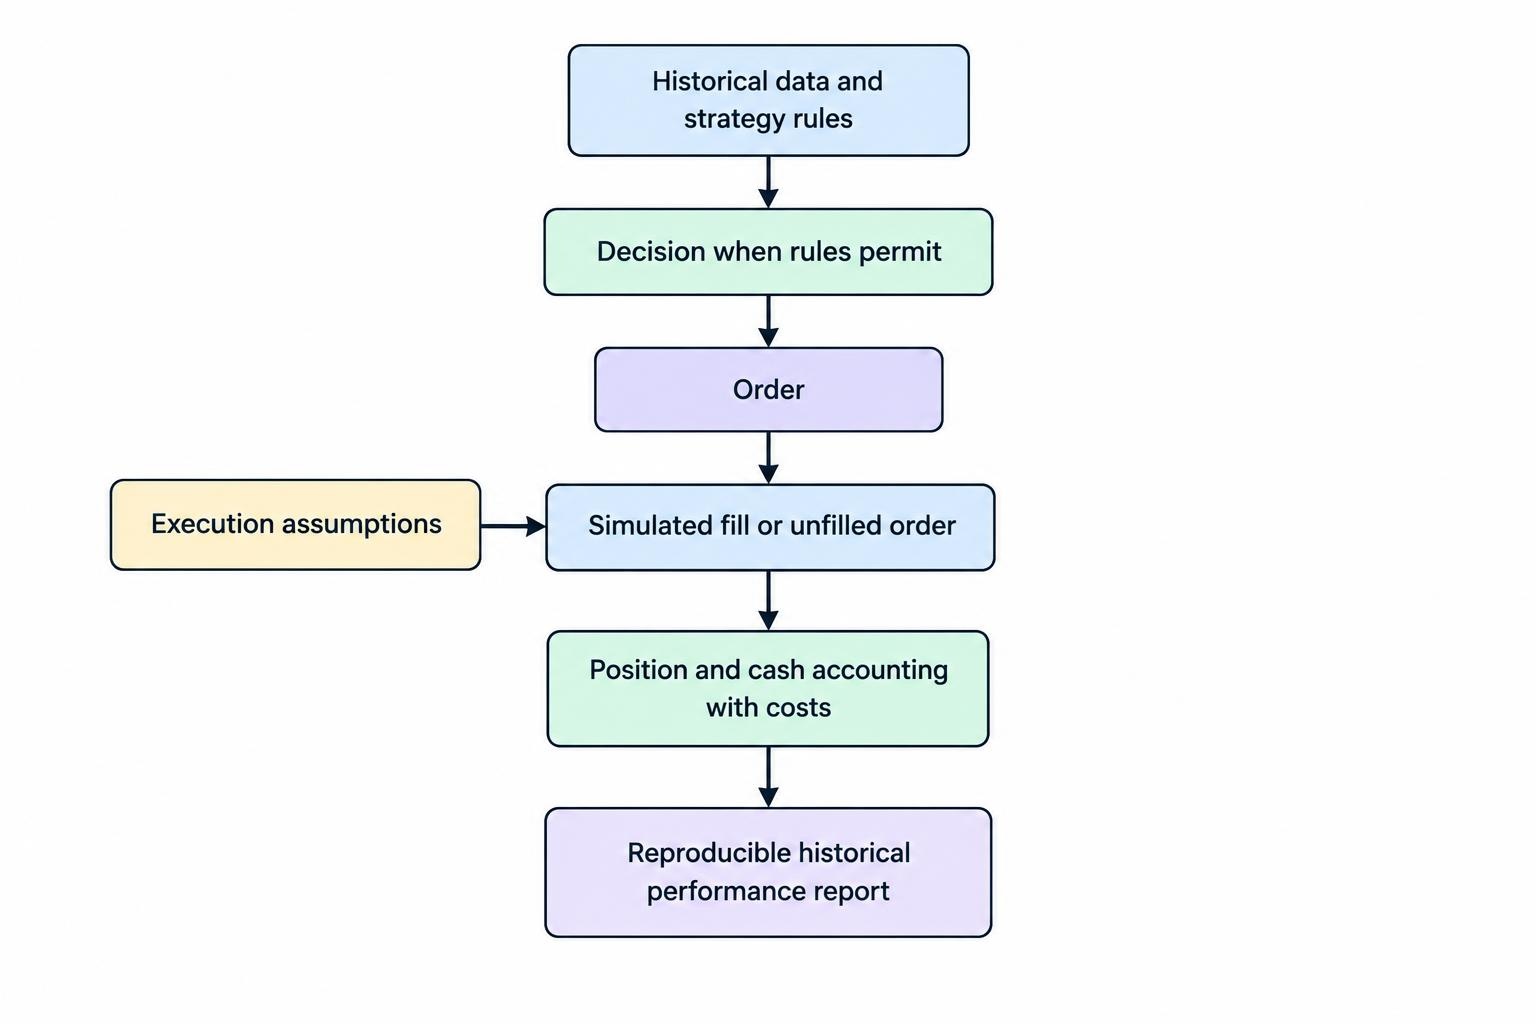
Backtesting an automated trading strategy means running its rules against historical data to estimate how it would have traded. A useful test reconstructs decisions, orders, positions and costs in the order they could have occurred. It does more than draw a profitable equity curve.
The purpose is to find reasons a strategy might fail before money is exposed. Does the result survive realistic execution costs? Does it depend on one unusually profitable month? Could the system have known each input when it placed the trade?
Within the development of automated trading systems, backtesting is a research stage, not permission to switch on live execution. Its output should be a reproducible report with explicit assumptions, not a screenshot of the best run.
What a Backtest Can and Cannot Establish
A backtest can show how programmed rules behaved within a historical dataset and execution model. It can reveal excessive turnover, concentrated exposure, long losing periods and mistakes in position sizing. It can also help reject an idea that fails before costs become more demanding.
It cannot establish that future returns will resemble simulated returns. Historical simulations benefit from hindsight and may misrepresent liquidity, slippage and the practical difficulty of continuing through losses. These weaknesses are addressed in the NFA guidance on hypothetical performance results.
Treat the result as conditional: these rules produced these simulated outcomes, using these data and assumptions. That qualification belongs beside the performance figures, not buried beneath them.
Define the Strategy Before Testing It
Write a specification that another person could implement without guessing. “Buy strong stocks” is an idea. A rule that identifies eligible stocks, measures strength at a stated time and defines the next permitted order is testable.
Record the traded instruments, signal calculations, trading hours, order types, exits, capital allocation and exposure limits. Include what happens when data is missing, an order remains unfilled or several signals compete for the same cash. The guide to entry, exit and position-sizing rules covers those design decisions in more detail.
For a hypothetical daily trend strategy, the specification might calculate a signal after the session closes and submit an order for the following session. It should also say whether the system allows short positions, how it handles an existing position and when it recalculates order size.
Set research acceptance criteria before reviewing results. These might cover maximum acceptable drawdown, performance after costs and the extent to which profits depend on a few trades. There is no universal passing score, but moving the goalposts after every run makes a weak strategy look surprisingly athletic.
Choose Data That Matches the Trading Decision
Match the Resolution to the Execution Assumptions
Daily bars can support research into strategies that make daily decisions. They cannot reveal every price movement within a session. If a stop and profit target both fall inside the same bar’s range, the bar alone does not establish which order would have executed first.
Use finer data when that sequence matters, or apply a documented conservative assumption. Do not let the engine select whichever sequence produces the larger profit.
Check whether the dataset contains trades, bid and ask quotes, or aggregated prices. A strategy researched on last traded prices still needs an execution model; the last price is not a promise that the next order can trade there.
Check the Historical Universe and Adjustments
Audit missing observations, duplicate timestamps, time zones, session boundaries and corporate actions. For equities, establish how splits and dividends affect both signals and portfolio accounting. Avoid counting a dividend twice through adjusted prices and a separate cash payment.
A historical stock universe should reflect securities eligible at the time, rather than only companies still trading today. Futures research also needs explicit contract selection and rollover rules. The supporting guide to historical market data quality and cleaning covers the broader preparation process.
Keep a dated copy or identifiable version of the dataset. Otherwise, a corrected price file can change results without any strategy code changing.
Model Orders, Costs and Capital Constraints
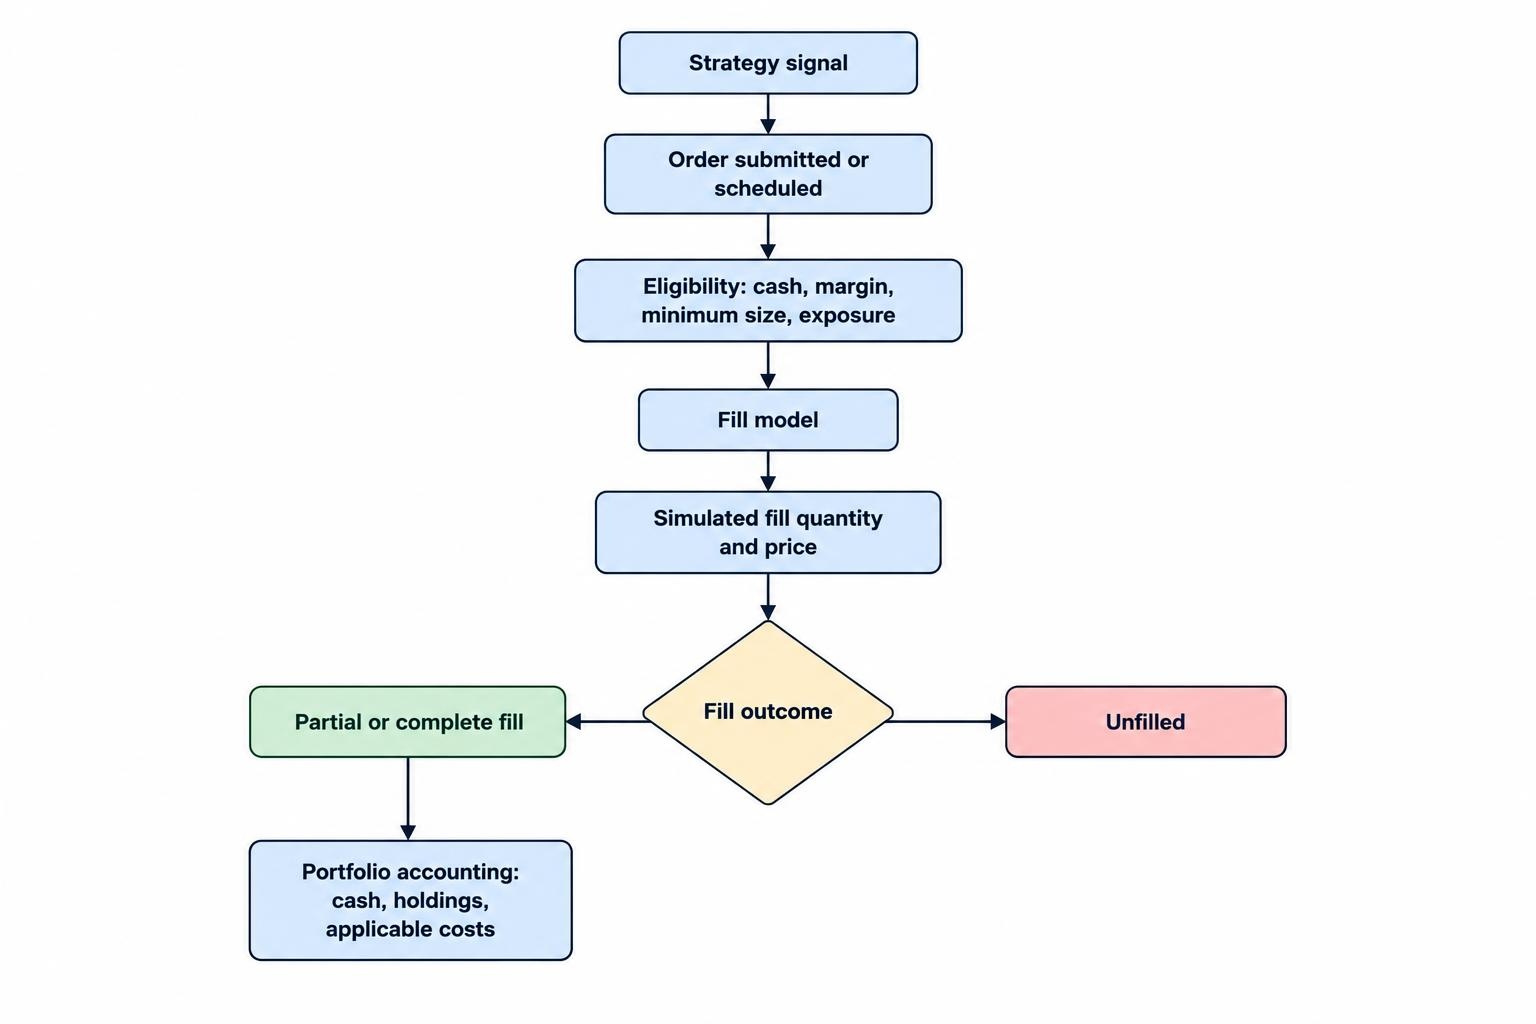
The signal identifies what the strategy wants to do. The execution model determines what the simulated account actually does. Keep those responsibilities separate so that an attractive signal cannot bypass an inconvenient trading constraint.
Make Fill Assumptions Explicit
Document when an order becomes eligible to execute, which prices determine its fill and whether it can fill partially. A limit price being touched does not, by itself, establish that your entire order would have traded.
Default settings deserve inspection. QuantConnect’s trade-fill model documentation states that its prebuilt backtest fill models assume complete fills; partial fills require a custom model. The same documentation distinguishes fill prices, quantities, spread treatment and slippage. Those are separate assumptions, even when a platform packages them together.
For larger orders, add a capacity check against available liquidity. A small simulated order and a large production order should not automatically receive identical execution treatment.
Include the Full Trading Cost
Model commissions, exchange charges, spread and slippage where applicable. Add financing, short borrowing and currency conversion when the strategy incurs them. Check the accounting carefully: if simulated purchases already execute at the ask and sales at the bid, deducting another full spread would double count that cost.
The following arithmetic illustration assumes 100 completed round trips, each earning an average of $20 before costs. It is not a strategy performance estimate.
| Assumed cost per round trip | Gross profit | Total costs | Net profit |
|---|---|---|---|
| $8 | $2,000 | $800 | $1,200 |
| $16 | $2,000 | $1,600 | $400 |
| $24 | $2,000 | $2,400 | −$400 |
Enforce cash, margin, minimum order sizes and exposure limits inside the simulation. When several orders arrive together, the engine must allocate capital consistently rather than letting every order spend the same available balance.
Separate Development From Evaluation
Use an earlier period to develop the strategy and reserve later observations for evaluation. If parameter selection needs its own validation stage, distinguish that from the final test. The final period should remain untouched until the rules and selection process are fixed.
Once a test result influences a change, it has entered the development process. Calling it “out of sample” again does not restore its independence.
Keep a record of every meaningful configuration tried, including rejected versions. Searching many alternatives increases the opportunity to select a historical winner by chance. The research paper The Probability of Backtest Overfitting examines this selection problem and why a simple holdout is not a complete safeguard.
Use Walk-Forward Testing for Adaptive Rules
If the proposed system recalibrates periodically, simulate that schedule. Fit or select parameters using an earlier window, apply them to the next period, then move forward. Combine the resulting evaluation periods in chronological order.
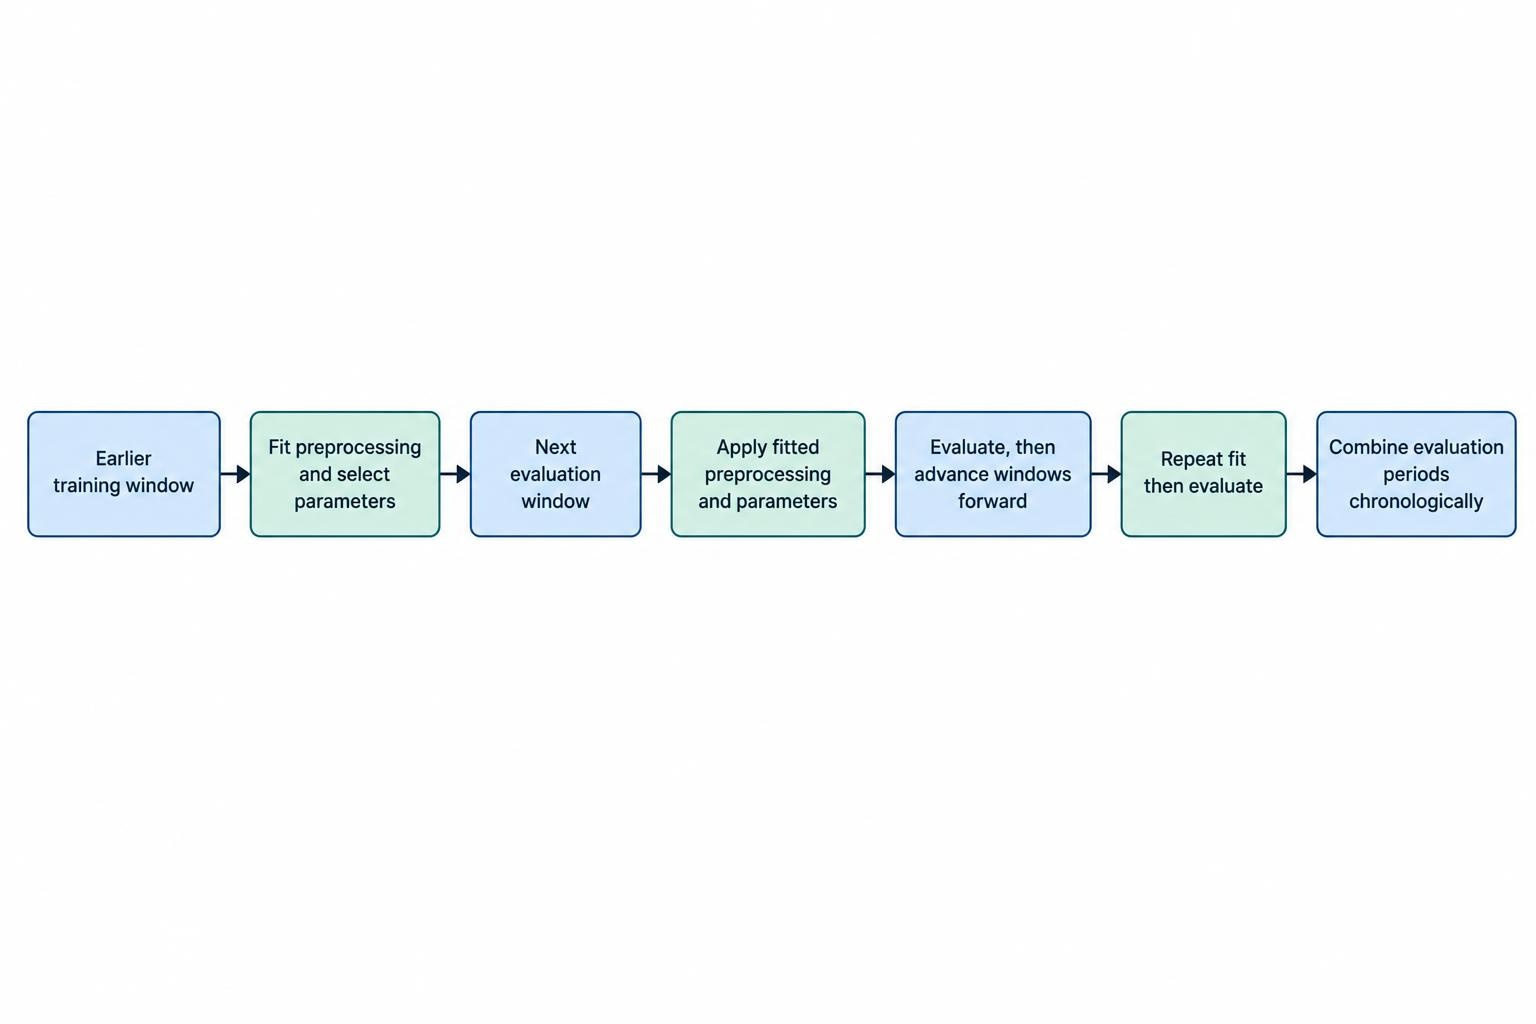
For a machine learning strategy, fit preprocessing steps on the training window too. Scaling inputs or selecting features using the full dataset can expose the model to information from its evaluation period.
Keep this process proportionate to the strategy. Detailed checks for future information, repeated optimization and contaminated samples belong in the companion guide to avoiding overfitting and look-ahead bias.
Audit the Engine Before Interpreting Performance
A plausible return does not prove that the implementation is correct. Start with a small, deliberately simple dataset whose expected behavior can be checked manually. Confirm that cash, holdings, fees and profit reconcile after each event.
Inspect individual trades from different circumstances: an ordinary entry, a losing exit, a gap through a stop, a corporate action and competing orders. Trace the information available at the decision time through to the final portfolio balance.
For each trade, retain the signal timestamp, order timestamp, simulated fill, quantity, costs and exit reason. Also record rejected and unfilled orders. Removing failed execution attempts from the record can conceal the very problem the test should expose.
Verify indicator warm-up handling and end-of-test positions. State whether final holdings are marked to market or forcibly closed, and whether liquidation costs are included. These choices should not change silently between runs.
Evaluate More Than Total Return
Read the equity curve alongside a compact set of performance measures. Each answers a different question; no single ratio can carry the whole decision.
- Net return: What remains after the modeled trading and holding costs?
- Maximum drawdown: How far did portfolio equity fall from a previous peak, including open positions?
- Recovery time: How long did equity remain below that peak?
- Trade expectancy: What was the average net outcome per completed trade?
- Exposure and turnover: How much capital was committed, and how frequently was it traded?
- Profit concentration: How much of the result came from a few trades, instruments or periods?
Calculate returns from portfolio equity rather than adding trade percentages with different position sizes. When using Sharpe or other risk-adjusted measures, document the return frequency and calculation convention.
Compare the strategy with a relevant benchmark over matching dates and with comparable treatment of distributions and costs. A long-only equity strategy needs context about market exposure; a strong return during a rising market does not automatically establish useful timing ability.
Report trade count without treating it as a quality certificate. Closely related trades can share the same exposure, so hundreds of executions may contain less independent evidence than the count suggests.
Stress Test the Assumptions
Rerun the strategy with worse costs, delayed execution and tighter liquidity assumptions. Test nearby parameter values rather than only the chosen setting. Prefer a defensible range of acceptable behavior to one narrow peak surrounded by losses.
Break results down by time period, instrument and market conditions. Where the history permits, inspect rising and falling markets, calm sessions and volatile periods. Explain where the strategy loses rather than averaging every weakness into one annual return.
As a diagnostic, remove the largest winning trades and inspect the change. Do not automatically reject a trend strategy because occasional large gains matter; that may match its intended behavior. The question is whether the dependence is economically plausible and supported by enough observations.
Set stress scenarios before seeing which ones the strategy survives. Otherwise, stress testing becomes another round of parameter shopping.
Decide Whether to Reject, Revise or Forward Test
Reject the strategy when the result depends on unavailable information, unrealistic fills or assumptions that cannot be defended. Revise it when the audit identifies a genuine implementation error, then document the change and repeat the evaluation process.
A candidate worth further testing should have reproducible results, understandable losses, realistic costs and evidence beyond its development sample. It should also have written operating limits and a clear explanation of when it should stop trading.
The next stage is forward observation, usually through simulated trading before any carefully controlled live trial. The distinction between paper trading and live trading for automated systems matters because simulated execution still cannot establish real fill quality or market impact.
Archive the strategy version, dataset version, parameters, test dates, execution assumptions and complete results. The useful outcome is not the most flattering historical return. It is a decision that another reviewer can reconstruct, challenge and reproduce.