A rules-based trading system turns a trading idea into a repeatable process. It defines when a trade qualifies, how much exposure to take, when to exit and when to do nothing. The purpose is not to eliminate losses. It is to make decisions consistent enough to test, execute and review.
Building one requires more than choosing an indicator. You need a market hypothesis, clear instructions, usable data, realistic cost assumptions and a process for deciding whether the evidence justifies risking money. Within the broader subject of trading systems, this is the work that connects an idea to an operating method.
The process below starts with a written specification and ends with controlled deployment. The examples are hypothetical, not tested strategies or recommendations to trade.
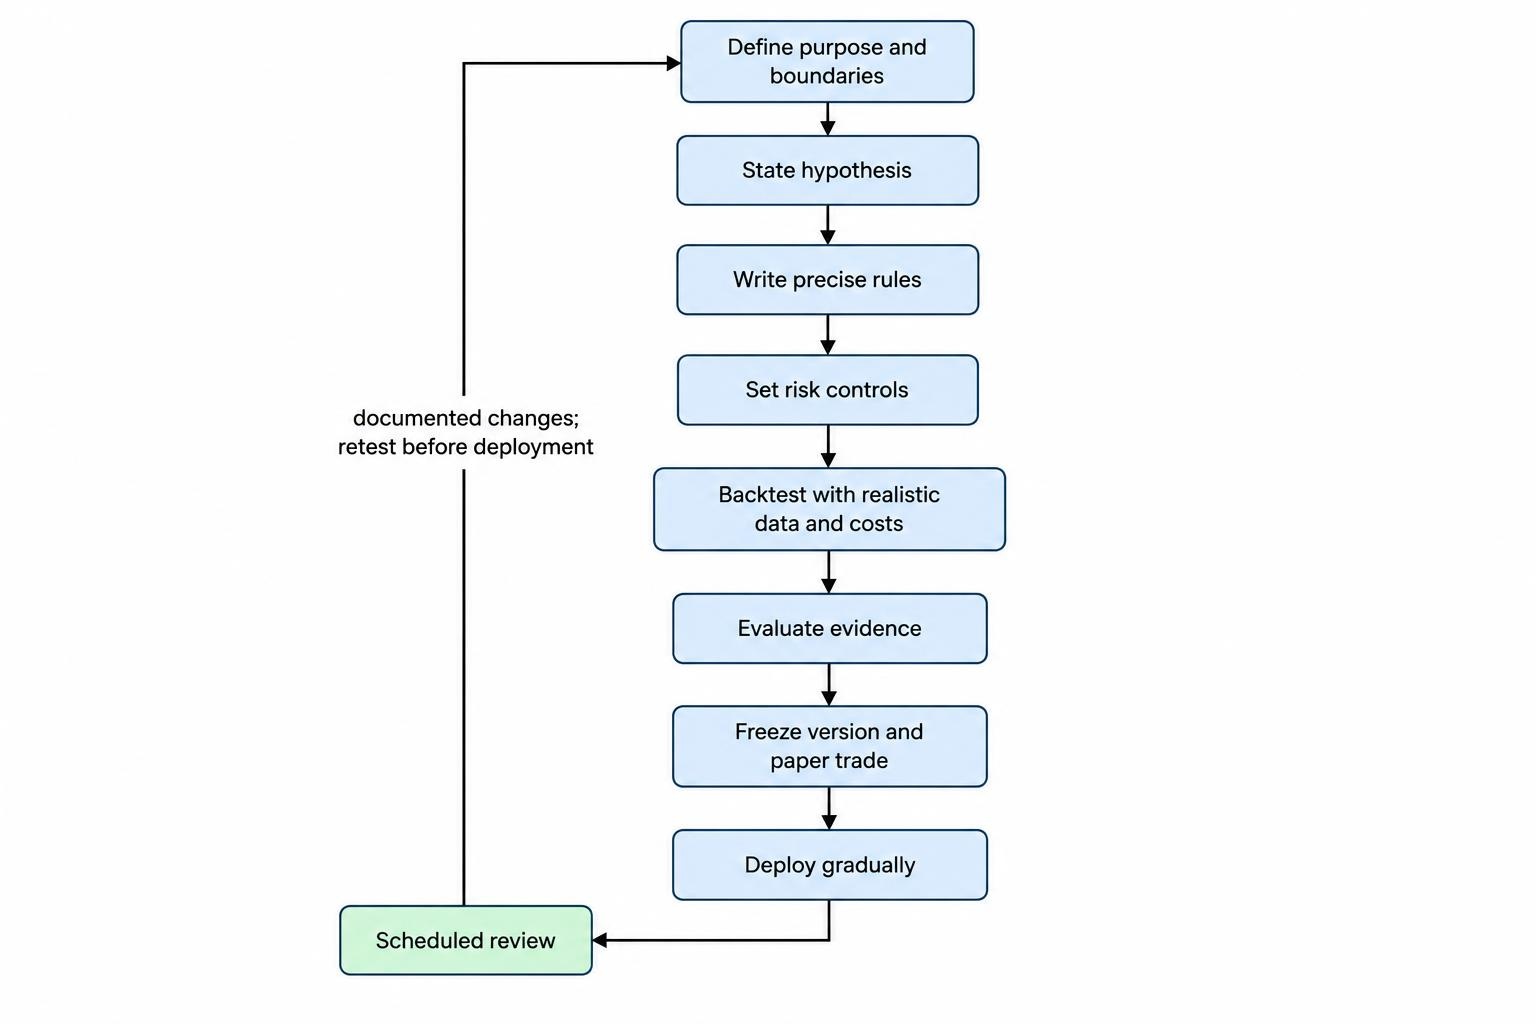
1. Define the System’s Purpose and Boundaries
Start with the job the system must perform. “Make money trading stocks” is an ambition, not a specification. A useful brief identifies the instruments, holding period, available capital, acceptable exposure and time you can devote to execution.
A system that needs attention every few minutes does not fit a trader who checks prices after work. Nor should a strategy assume access to borrowing, short selling or order types that the account does not support. Resolve those constraints before researching signals.
Write a short operating brief that answers four questions:
- Which instruments and trading sessions are eligible?
- How often will decisions be made, and how long might positions remain open?
- What capital and loss limits apply?
- Will execution be manual, assisted by alerts or automated?
Keep this first version narrow. One market and one decision frequency make it easier to trace errors than a system that trades everything from opening gaps to overnight currency moves.
2. Write a Hypothesis Before Choosing Indicators
A trading hypothesis states why a pattern might produce a return after costs. It should connect an observable condition with a proposed market behavior, rather than treating an indicator crossing as an explanation.
For example: “Persistent buying may allow price strength to continue over several sessions.” That gives you a trend hypothesis to investigate. A different hypothesis might propose that short bursts of selling reverse when temporary pressure fades. These ideas require different entry logic, exits and execution assumptions.
Write down where the hypothesis should struggle too. A trend system might suffer repeated reversals in a sideways market. That possibility belongs in the research plan before it appears in the results.
Choose the simplest measurement that expresses the idea. If a price threshold does the job, adding three indicators that measure much the same thing creates more settings to investigate, not necessarily more useful information. Every rule should have a reason to exist.
3. Turn the Hypothesis Into Unambiguous Instructions
Rules must produce the same decision when two people receive the same information. “Buy a strong breakout” fails that test. It leaves strength, timing and the breakout level open to interpretation.
A clearer instruction would be: “After the regular session closes, check whether the closing price exceeds the highest closing price of the previous 20 completed sessions.” That identifies the observation time, comparison and lookback window. It still needs an execution rule: a signal calculated after the close cannot assume an earlier fill at that closing price.
Use separate instructions for eligibility, entry, position size, exit and exceptions. The detailed mechanics belong in your specification for entry, exit and position-sizing rules. At the system level, the task is to make those instructions work together without contradictions.
An Illustrative System Specification
The following example shows the level of precision needed for an initial research draft. Its thresholds are arbitrary research inputs, not evidence of an edge.
| Component | Example instruction |
|---|---|
| Market | One named, unleveraged equity ETF selected before testing; long positions only. |
| Entry signal | While flat, flag a signal when the regular-session close exceeds all closes from the previous 20 completed sessions. |
| Entry execution | Model entry at the next regular-session opening price, with an adverse slippage allowance and transaction costs. |
| Exposure | Allocate no more than 10% of current account equity, rounded down to whole shares; hold one position at a time. |
| Protective exit | Set an initial sell stop 5% below the actual entry fill; do not move it farther from the entry. |
| Signal exit | If the close falls below every close from the previous 10 completed sessions, exit at the next regular-session open. |
| Exceptions | No additional purchases while holding. No new entry at an opening where an exit occurs. Missing required data blocks new entries. |
Before testing, resolve remaining details such as session calendars, distributions, price adjustments and stop execution during gaps. The table is a research draft, not permission to leave inconvenient cases to guesswork.
4. Design Risk Controls Separately From the Signal
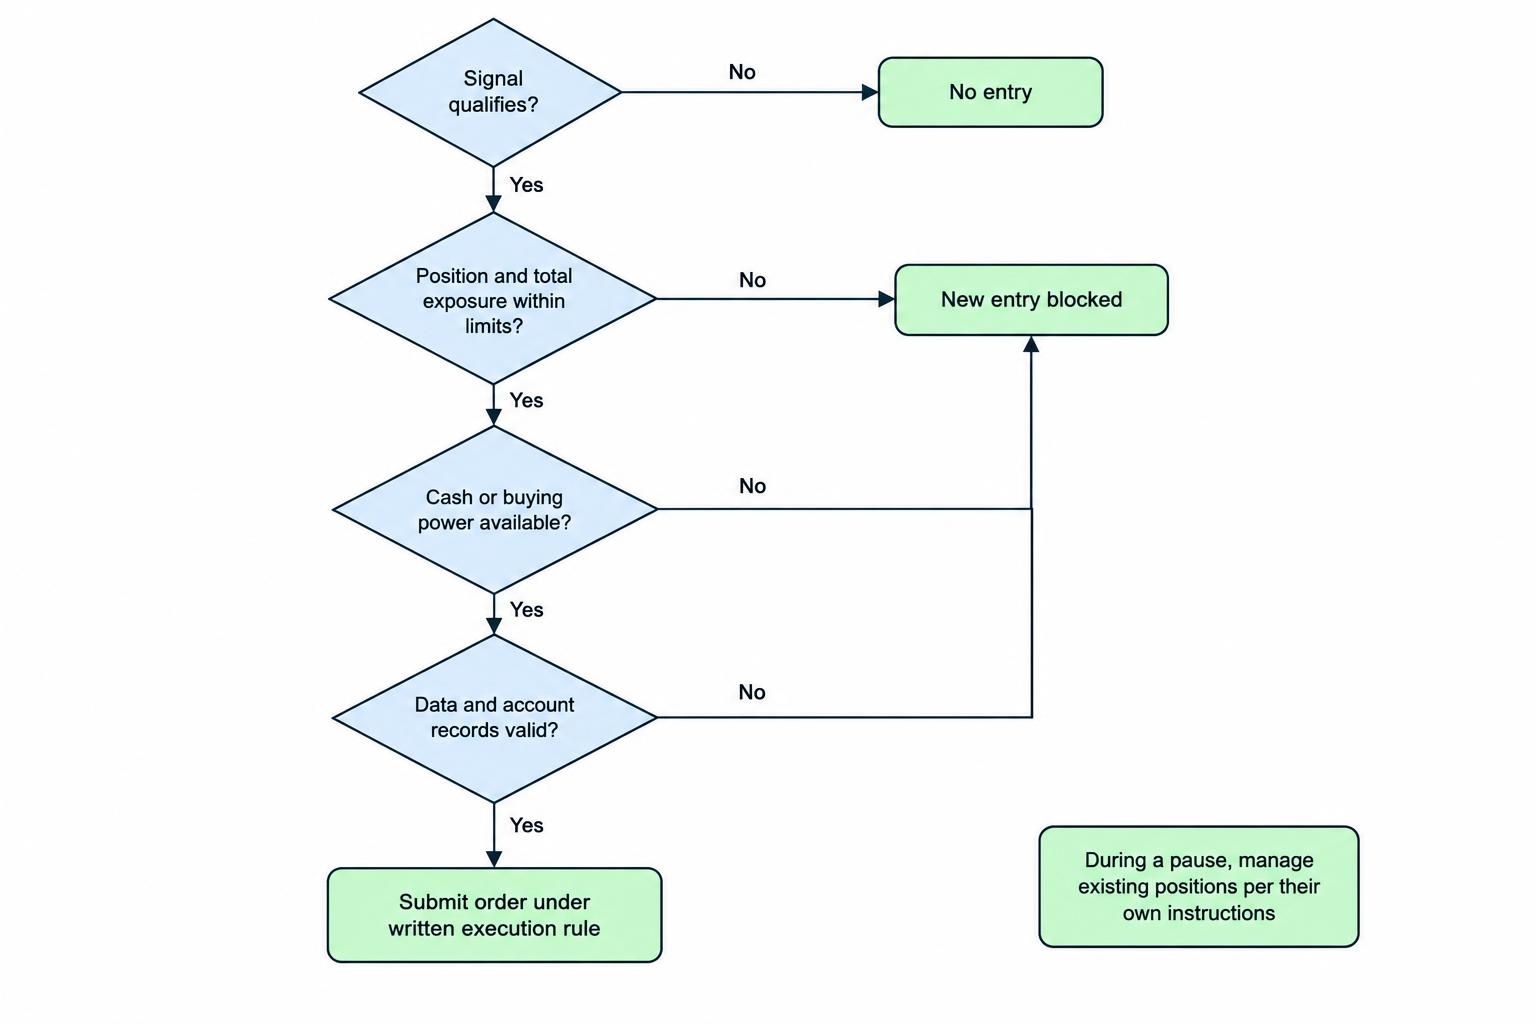
The signal decides whether a trade qualifies. Risk controls decide whether the account can accept it. Keep those decisions separate so an attractive setup cannot bypass an exposure limit.
Set limits for individual positions, total exposure and related positions. Five trades tied to the same industry may share much of the same risk, even if each passes its own size check. Include a cash or buying-power check before submitting an order.
Distinguish planned loss from possible loss. In the example above, a 10% account allocation and a stop 5% below entry imply a planned price loss of roughly 0.5% of account equity, before costs. They do not establish a maximum loss.
For U.S. stocks, a triggered stop order becomes a market order, and the execution price is not guaranteed. A gap can therefore produce a loss beyond the planned amount. The SEC’s explanation of stock order types supports treating the stop as an execution instruction, not insurance.
Also define a pause procedure. State what happens when data becomes stale, an order is rejected or account positions disagree with the system’s records. Blocking new entries is different from managing an existing position; both need instructions.
5. Build a Backtest That Respects Information Timing
A backtest should reconstruct what the system could have known and done at each decision point. It should not let later information improve earlier decisions.
Start by checking timestamps, trading sessions, missing observations and price adjustments. For a stock universe, establish which companies were eligible at each historical date rather than applying today’s membership to the past. Otherwise, the test can benefit from knowing which businesses survived.
Match the data resolution to the rules. Daily bars may support signals calculated after the close, but they do not reveal every movement within a session. If a strategy uses intraday stops or targets, document how the test handles uncertain event order. Do not automatically choose whichever sequence produces the better result.
Use a consistent treatment of splits and distributions across signals, holdings and returns. An adjusted signal series combined carelessly with unadjusted execution prices can create trades that make no economic sense.
Model commissions, spread, slippage and any applicable financing or borrowing charges. For frequent intraday strategies, cost assumptions deserve particular scrutiny: FINRA’s day-trading risk disclosure warns that accumulated transaction costs can reduce earnings or increase losses.
Keep an audit trail of signals, orders, fills and account equity. A profit chart cannot tell you whether the simulator bought before the signal existed. For implementation detail, use the separate guide to backtesting an automated trading strategy.
6. Evaluate the System Without Optimizing Away the Evidence
Before running the test, decide what would justify further research and what would reject the idea. Otherwise, it is easy to change the definition of success after seeing the results.
Review net return alongside maximum drawdown, time under water, turnover, market exposure and the distribution of trade outcomes. Compare performance with an appropriate passive alternative over the same dates, including distributions where relevant. A strategy that spends most of its time in cash needs context beyond its headline return.
Win rate alone is not enough. A hypothetical system that wins 40% of trades, earns an average of $200 on winners and loses an average of $100 on losers has an average gross outcome of $20 per trade. If average trading costs are $25, that outcome becomes negative. The arithmetic matters more than the reassuring percentage.
Separate Development From Evaluation
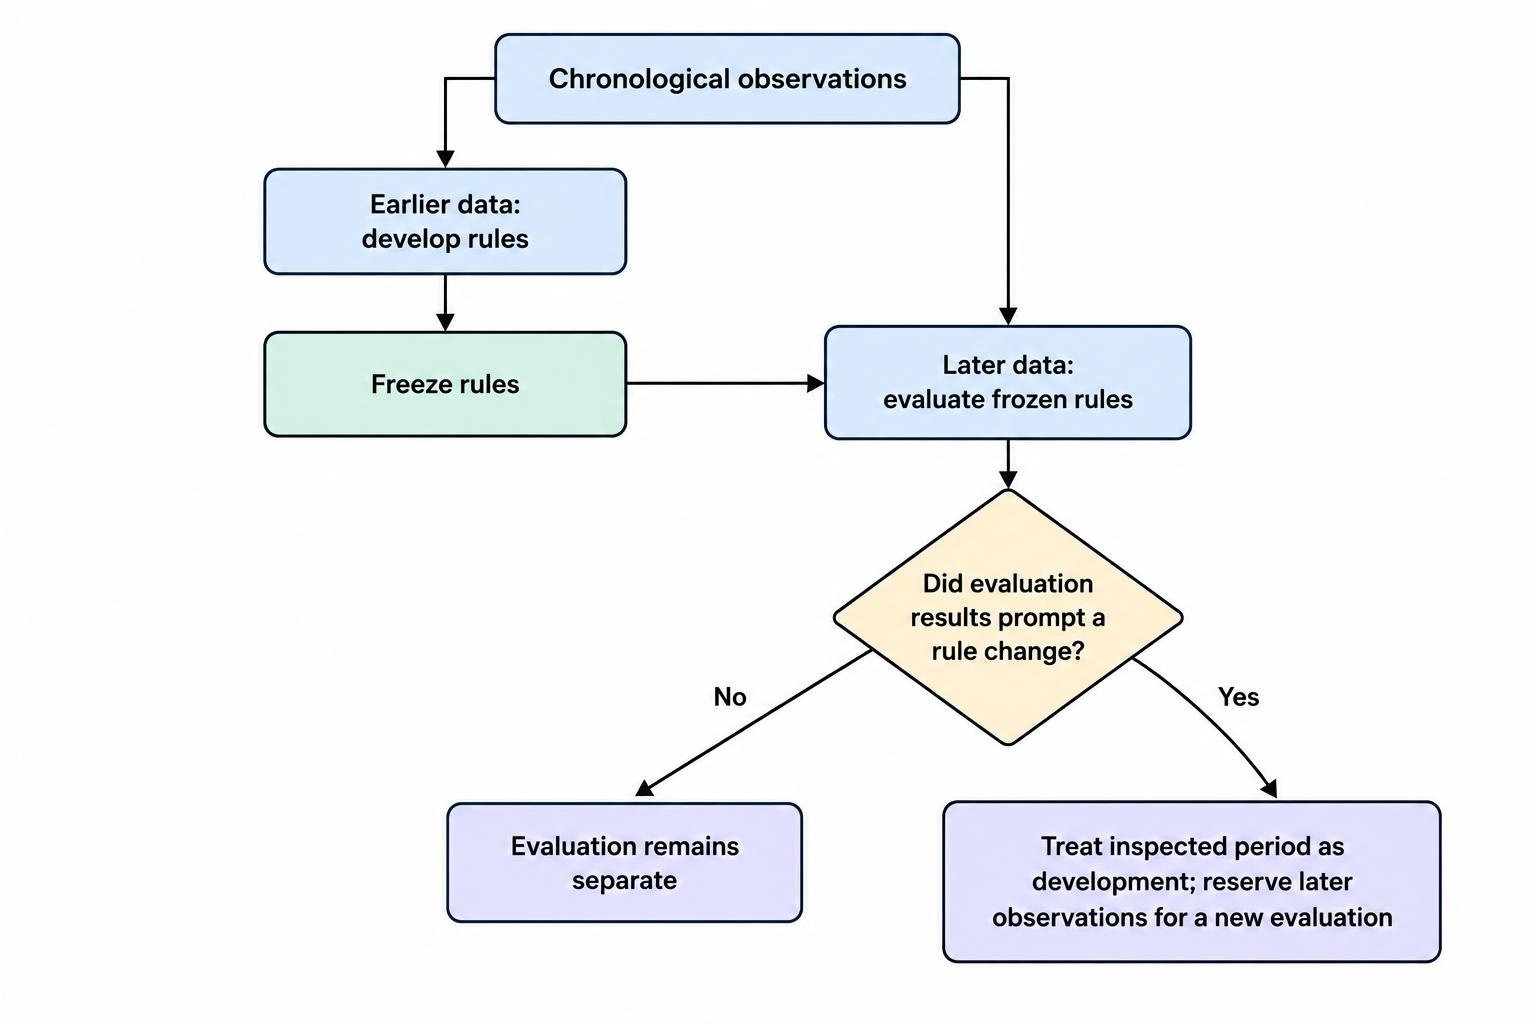
Use earlier observations for development and reserve later observations for evaluation. Once you inspect an evaluation period and change the rules in response, treat that period as part of development. It is no longer untouched evidence.
Record every variation tested, including rejected versions. Repeatedly searching the same data can produce attractive results that reflect historical noise rather than a repeatable effect. The research paper The Probability of Backtest Overfitting examines this multiple-testing problem and why a simple holdout does not, by itself, resolve it.
Use chronological testing across more than one market environment, then examine sensitivity to reasonable changes in costs, execution delays and neighboring parameter values. Treat an isolated winning setting with suspicion. There is no universal trade count or test duration that certifies a system as reliable.
7. Choose Tools That Preserve the Specification
You do not need to automate a system to make it rules based. A spreadsheet, written checklist and reliable data may be sufficient for a low-frequency prototype. Automation becomes useful when the operating requirements exceed what manual execution can handle consistently.
Choose tools around the specification, not the other way round. Check that the platform supports the required data, order behavior, position accounting and exportable records. A convenient interface is little comfort if its simulator applies different rules from its live order system.
If you use code, verify calculations against small examples you can check manually. Test flat markets, missing prices, gaps and rejected orders, not just ordinary sessions. If you use AI to draft rules or software, review every assumption and calculation. A plausible explanation is not a passed test.
8. Paper Trade the Frozen Version
Freeze a version of the rules before forward testing. Record the settings, data source, cost assumptions and software version so that each result belongs to an identifiable system.
Use paper trading to check the operating process: whether signals arrive on time, orders have the intended size, exits remain active and records match positions. Compare the intended action with the action actually recorded.
Do not treat simulated profit as proof of live execution quality. Instead, log what remains untested, including queue position, partial fills and adverse fills during fast moves. Where possible, compare simulated prices with contemporaneous executable quotes rather than the last traded price.
The distinction between paper trading and live trading for automated systems matters here: operational readiness and evidence of a trading edge are different tests. Passing one does not establish the other.
9. Deploy Gradually and Review Changes on Schedule
If the evidence supports proceeding, begin with exposure small enough that an implementation error remains financially manageable. Do not increase size simply because the first few trades win. Define the conditions for any increase beforehand.
Monitor both strategy behavior and execution quality. Track actual costs against modeled costs, missed signals, rejected orders and unexplained position differences. A system can follow its rules correctly and lose money; it can also make money while malfunctioning. Neither profit nor loss replaces an operational check.
Keep research changes separate from the live version. Review proposed amendments on a schedule, document the reason and test them before deployment. Avoid rewriting an exit rule halfway through a losing trade because the new version feels more comfortable.
A usable rules-based trading system is a documented decision process with evidence, boundaries and a stop procedure. Its first achievement is not a smooth equity curve. It is making every trade, skipped trade and intervention explainable against instructions written before the outcome was known.