A trading journal records what you traded, why you traded it, how much you risked, and what happened after costs. Performance tracking turns those records into a review of profitability, drawdowns, execution, and rule adherence. The purpose is not to collect screenshots. It is to decide which actions deserve repeating and which need to stop.
A useful journal separates three questions: did the strategy produce a positive result, did you follow its rules, and did the trading account earn an acceptable return for the risk taken? Those answers can differ. Within a trading system, the journal provides the feedback needed to distinguish a strategy problem from an execution problem.
What a Trading Journal Should Record
Keep two connected records: a transaction log containing the numbers, and a decision journal containing the reasoning. Imported executions can show where you bought and sold. They cannot establish whether the entry met your criteria or whether you moved a stop because the trade became uncomfortable.
Record the original decision before the outcome is known. Add the review afterward without overwriting the initial explanation. Otherwise, a losing trade can acquire an entirely new backstory by dinner.
Capture the plan and the actual execution
Use the following fields as a starting structure rather than a requirement to write an essay about every trade:
- Identification: trade ID, instrument, direction, account, strategy name, and rule version.
- Timing: decision time, entry and exit timestamps, time zone, and holding period.
- Original plan: entry condition, invalidation point, exit method, position size, and planned cash risk.
- Actual execution: filled quantities and prices, partial exits, stop changes, and order problems.
- Financial result: gross profit or loss, charges, net result, and result relative to planned risk.
- Review: rule adherence, relevant market conditions, chart evidence, and one actionable observation.
Price targets, entry and exit points, trade timing, and a daily review are also central to the CME Group trade-log framework. Keep the record concise enough that completing it remains practical during busy sessions.
Define what counts as one trade
A position opened through three fills and closed through two exits should not automatically become five trades. Preserve each execution in the raw data, then group related fills under a position or trade ID. State whether adding to a position belongs to the original trade or starts another recorded decision.
For strategies with several legs, keep the legs together when evaluating the complete position. Otherwise, a profitable hedge and its losing counterpart may appear to be unrelated decisions.
Make the journal match your entry, exit, and position-sizing rules. If the strategy requires a closing-price confirmation, record whether that confirmation existed at entry. A general label such as “good setup” gives you little to audit later.
Calculate Results After Trading Costs
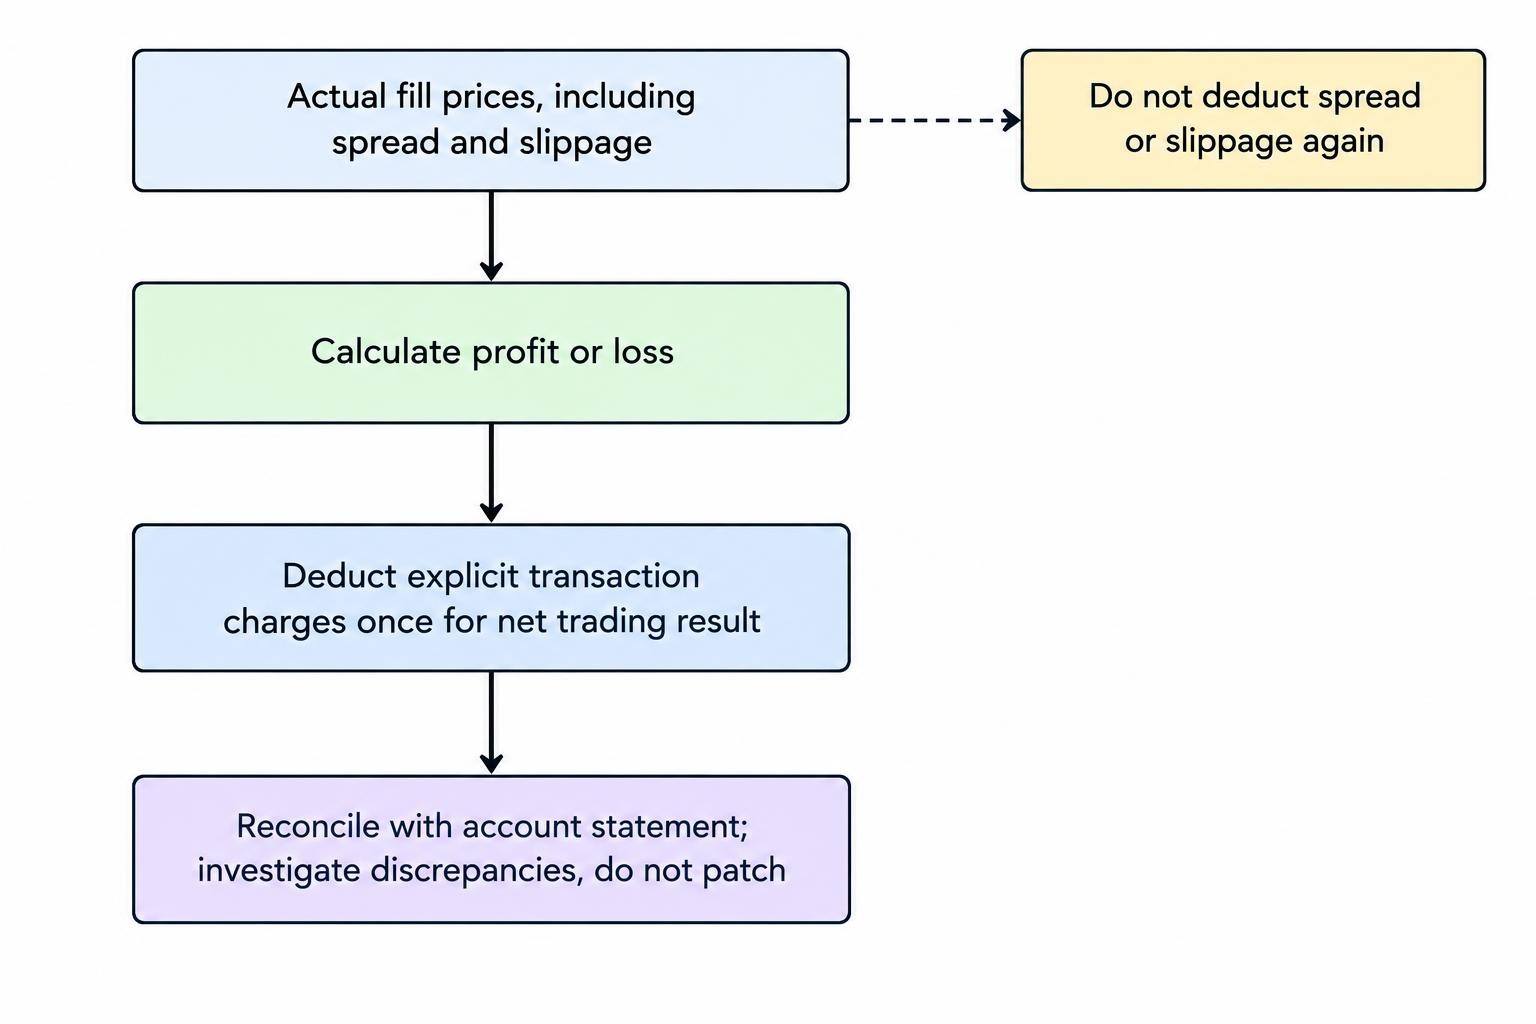
Start with profit or loss calculated from actual fills. Subtract commissions, exchange and regulatory charges where applicable, financing, borrowing costs, and other directly attributable charges. If an imported figure already includes a charge, do not subtract it again.
Keep execution costs separate from explicit charges. Spread and slippage affect the prices received, so their effects are already reflected in profit or loss calculated from actual fills. You can measure them separately against a chosen reference price, but subtracting those measurements again would double count the cost.
Account fees, platform subscriptions, and research costs deserve a separate monthly total. This lets you distinguish trading results after transaction costs from results after operating expenses. Fees reduce returns, including charges that do not appear beside individual trades; the SEC investor bulletin on fees and expenses identifies account statements, confirmations, and fee schedules as records worth checking.
Reconcile journal totals against the account statement. Investigate differences rather than inserting a balancing adjustment. Missing fills, currency conversion, financing booked later, and inconsistent treatment of partial exits are all items to check.
Trading Performance Metrics That Answer Useful Questions
No single metric describes a trading strategy adequately. Use a compact dashboard that connects profitability with losses, capital use, and decision quality. Define each calculation once and apply it consistently across reporting periods.
| Metric | Calculation | What it helps assess |
|---|---|---|
| Net profit or loss | Total trade results after recorded trading charges | Whether the recorded activity made money |
| Win rate | Winning trades divided by all closed trades | How frequently trades finished profitable |
| Average win and loss | Total winning or losing results divided by the corresponding trade count | The size of gains relative to losses |
| Historical expectancy | Total net trade result divided by closed-trade count | The average recorded result per trade |
| Profit factor | Sum of positive net trade results divided by the absolute sum of negative net trade results | Recorded gains relative to recorded losses |
| Maximum drawdown | Largest peak-to-trough decline in the chosen equity series | The worst decline observed during the period |
| Rule adherence | Trades meeting every required rule divided by assessed trades | Whether execution matched the plan |
Count breakeven trades separately while retaining them in the total trade count. Profit factor is undefined when the sample contains no losses; it is not evidence of an infinitely good strategy. Historical expectancy describes the sample, not a guaranteed result for the next trade.
A worked example: winning often is not enough
Consider a hypothetical record of 100 trades. Forty trades earn an average of $180 before explicit charges, while 60 lose an average of $100. Gross gains total $7,200 and gross losses total $6,000, leaving $1,200 before charges.
If explicit charges average $5 per trade, total charges are $500 and net profit is $700. Historical net expectancy is therefore $7 per trade. The win rate remains 40%, but that figure alone does not tell you whether the record was profitable.
Assuming every trade incurs the same $5 charge, winning trades contribute $7,000 after charges and losing trades total $6,300 after charges. Net profit factor is approximately 1.11. These are illustrative calculations, not a return forecast.
Use R-multiples to compare planned risk
Define one R as the cash risk assigned to the trade at entry. If planned risk is $100 and the net result is $150, the outcome is +1.5R. A $120 net loss is −1.2R.
Keep that original denominator fixed. Widening a stop after entry should not rewrite the initial risk estimate. Also, planned risk is not a guaranteed maximum loss: a worse exit can produce a loss beyond one R. Where a strategy has no meaningful predefined risk amount, do not force it into an R-based comparison.
Track Account Equity, Not Just Closed Trades
A closed-trade report can look healthy while open positions carry large losses. Maintain an equity record that includes unrealized profit and loss, using a consistent valuation time and method. Keep a separate closed-trade curve for strategy analysis.
For example, an equity decline from $25,000 to $22,000 represents a 12% drawdown from that peak. Recovering from $22,000 to $25,000 requires approximately 13.6%. Record drawdown duration too: the time spent below a previous equity high answers a different question from the size of the decline.
Sampling matters. End-of-day equity will not show an intraday decline that recovered before the close. Label the measurement frequency so a daily drawdown figure is not mistaken for the worst loss experienced at any moment.
Separate deposits and withdrawals from performance. With no external cash flows, percentage return is the change in equity divided by starting equity. With cash flows, use a documented return method. Time-weighted returns separate performance from external cash-flow timing; money-weighted returns reflect that timing. Do not label an unadjusted balance increase as trading return.
Separate Decision Quality From Trade Outcomes
A profitable rule violation is still a rule violation. A properly executed losing trade may require no correction at all. Score the process independently of the result, preferably against conditions recorded before entry.
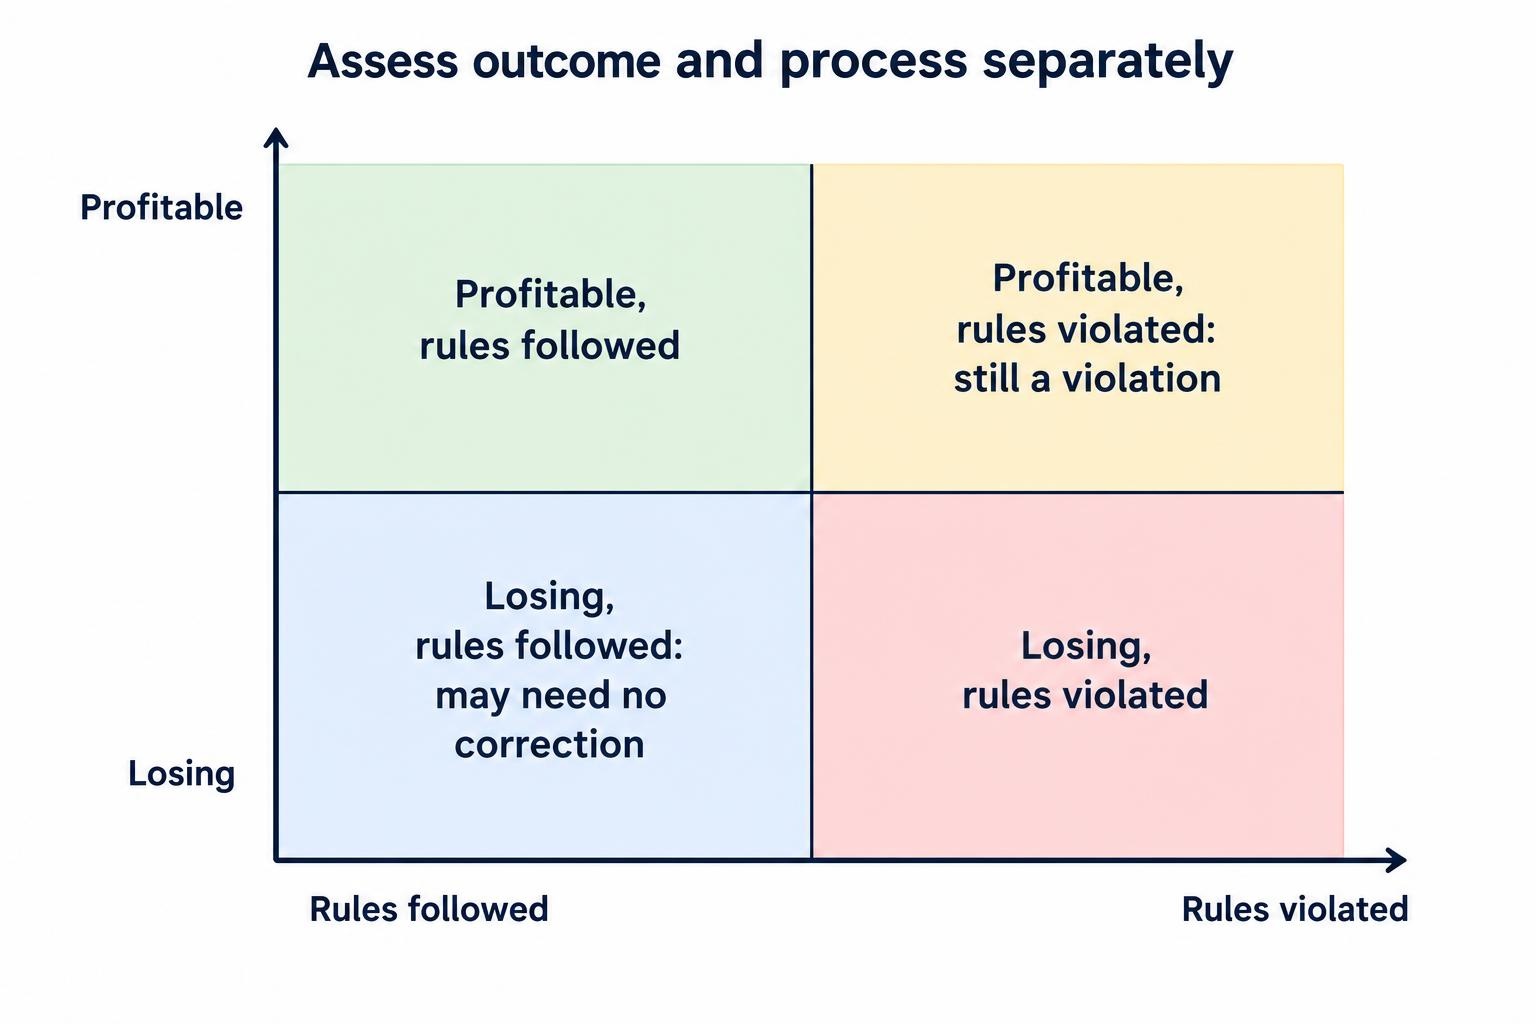
Use factual labels such as “entered before confirmation,” “exceeded planned size,” or “exit followed rule.” Labels such as “careless” or “bad psychology” are harder to measure and offer no clear repair.
Suppose a hypothetical review finds that early entries lost money while confirmed entries were profitable. That observation justifies investigation, not an immediate declaration that confirmation guarantees an advantage. Check whether the groups also differed in market conditions, position size, or strategy version.
Track skipped qualifying opportunities in a separate observation log if missed trades are part of the review. Do not mix their estimated outcomes with live results. A missed entry has no actual fill, and its imagined exit can look remarkably tidy in hindsight.
Use a Repeatable Review Schedule
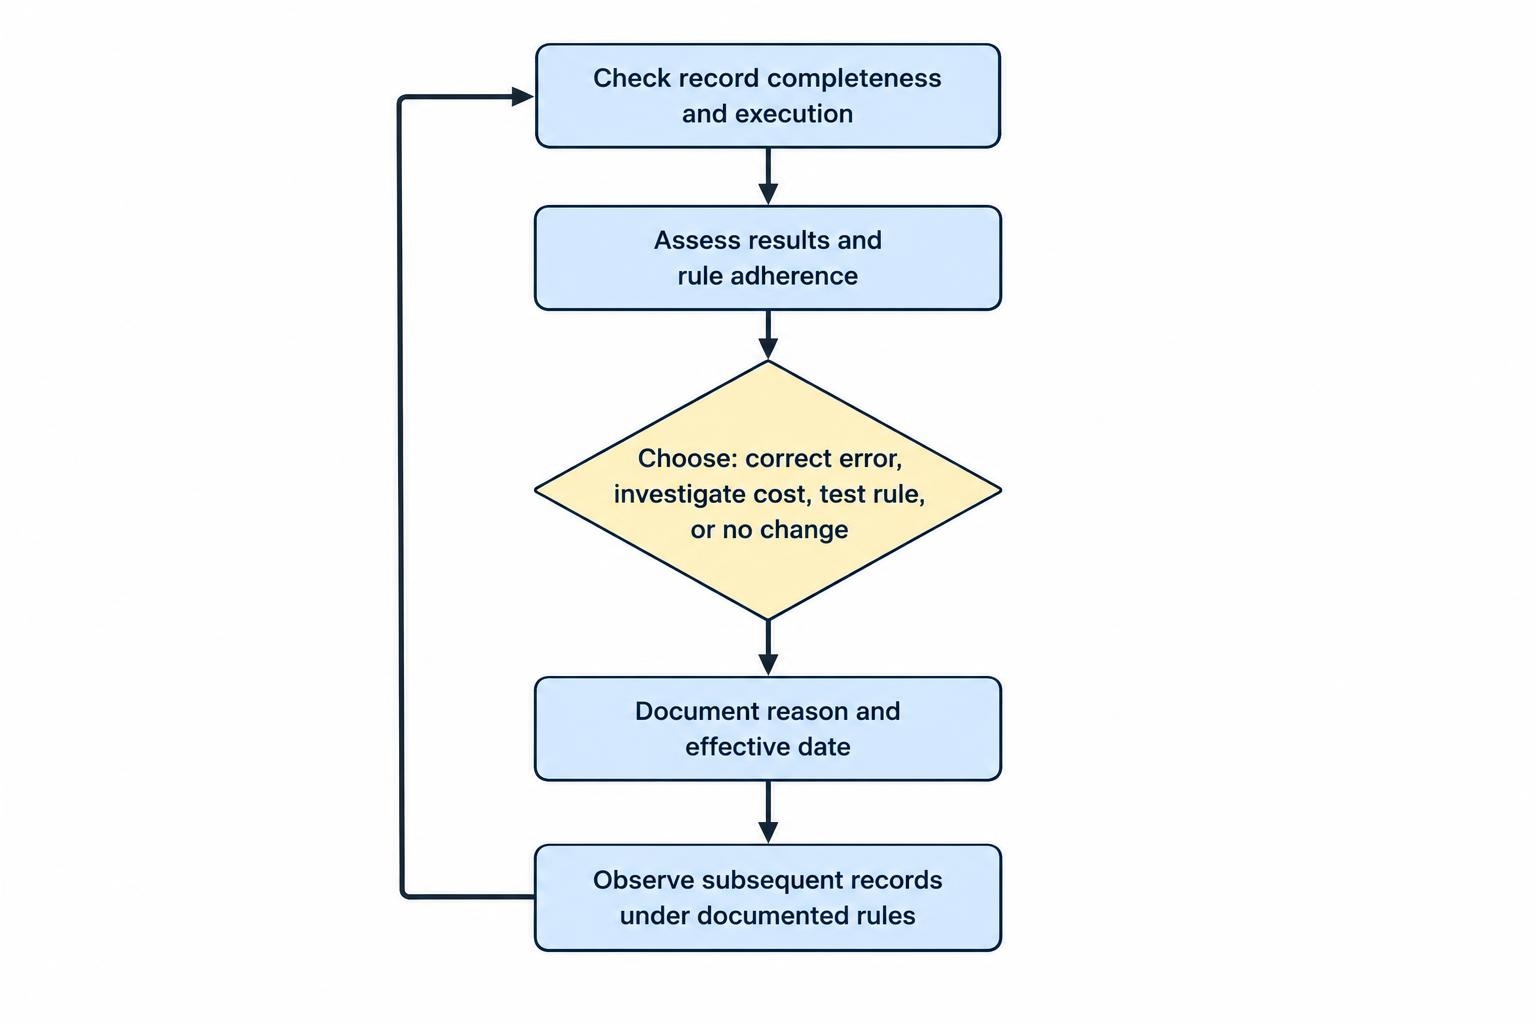
After each session, check completeness. Match fills, confirm charges, attach any useful evidence, and flag deviations. Keep this review factual. A difficult session is not the best reason to redesign the entire strategy.
Each week, inspect execution. Compare planned risk with realized losses, examine slippage against the same reference-price convention, and identify repeated rule breaches. Choose a small number of issues that can be corrected and measured.
At a scheduled strategy review, assess the record. Compare results by strategy and rule version before slicing them into smaller categories. Review net expectancy, drawdowns, holding periods, and exposure together. A larger dollar profit achieved through much larger positions does not, by itself, show better trading.
Document each proposed change with its reason, effective date, and review condition. Keep old records intact. This prevents revised rules from being credited with trades placed under a different plan.
Avoid Drawing Big Conclusions From Small Samples
There is no universal trade count that proves a strategy works. Fifty trades concentrated around one market event provide different evidence from fifty trades spread across varied conditions. Report both the number of trades and the dates covered.
Related observations also need care. Positions influenced by the same market move may provide overlapping evidence. The NIST guidance on non-random observations explains why dependence between observations can invalidate uncertainty calculations that assume independent data. Applied to a journal, this means trade count alone should not determine confidence.
Avoid filtering the record until an attractive subgroup appears. Testing enough combinations of session, instrument, weekday, and indicator setting can produce an appealing historical result by chance. Treat a newly noticed pattern as a hypothesis to assess on later observations, using the principles behind avoiding overfitting and look-ahead bias.
Choose Journal Tools That Preserve a Usable Record
A spreadsheet is sufficient when it supports accurate entry, consistent calculations, filtering, and backups. Dedicated journal software becomes useful when execution volume, multiple accounts, or complex positions make manual reconciliation difficult.
Assess tools by import accuracy, partial-fill handling, currency treatment, calculation transparency, and export options. Before relying on a dashboard, reconcile a small set of trades manually. Attractive charts cannot rescue incorrect inputs.
If a journal connects to an account, use read-only access where available and review its permissions. A reporting tool should not need trading or withdrawal authority. Keep credentials out of notes and screenshots, following appropriate practices for protecting trading accounts and API keys.
Turn the Journal Into a Decision Record
The useful output is a documented action: correct an execution error, investigate a cost increase, test a proposed rule, or leave the strategy unchanged because the evidence is inconclusive. Not every review needs a change.
Keep live, simulated, and backtested results visibly separate, and retain losing periods alongside profitable ones. Historical results cannot predict future strategy performance; the SEC bulletin on performance claims also addresses hypothetical results and selective presentation.
A trading journal cannot remove uncertainty. It can make the record accurate enough to show what happened, what you controlled, and what evidence you need before making the next change.