Market data is the record of prices, quotes, trading activity and instrument details that a trading system uses to make decisions. It feeds signal calculations, execution checks, position valuations and performance reviews. A strategy can have sensible rules and still fail operationally if its inputs describe the wrong market, arrive too late or contain gaps the software never notices.
The aim is not to collect every available field. It is to obtain the data your decisions require, preserve its meaning and detect when it stops being trustworthy. Start with the strategy’s trading horizon, instruments and execution method, then choose the feed, historical coverage and controls that fit those requirements.
What Data Does a Trading System Need?
“Price data” is not one interchangeable product. A completed trade shows where a transaction occurred. A bid or ask shows quoted buying or selling interest. A price bar summarizes activity over an interval. Each answers a different question, and none should silently stand in for another.
| Data type | What it contains | Typical system use |
|---|---|---|
| Trades | Execution price, quantity, time and associated conditions | Transaction analysis, volume calculations and trade-based indicators |
| Quotes | Bid and ask prices, quoted sizes and update times | Spread checks, execution estimates and quote-based signals |
| Order book updates | Changes to displayed orders or quantities at price levels | Liquidity analysis and order placement decisions |
| Price bars | Open, high, low, close and possibly volume for an interval | Slower signal calculations, screening and charting |
| Reference and status data | Instrument identifiers, contract details, sessions and trading status | Correct interpretation of prices and trading eligibility |
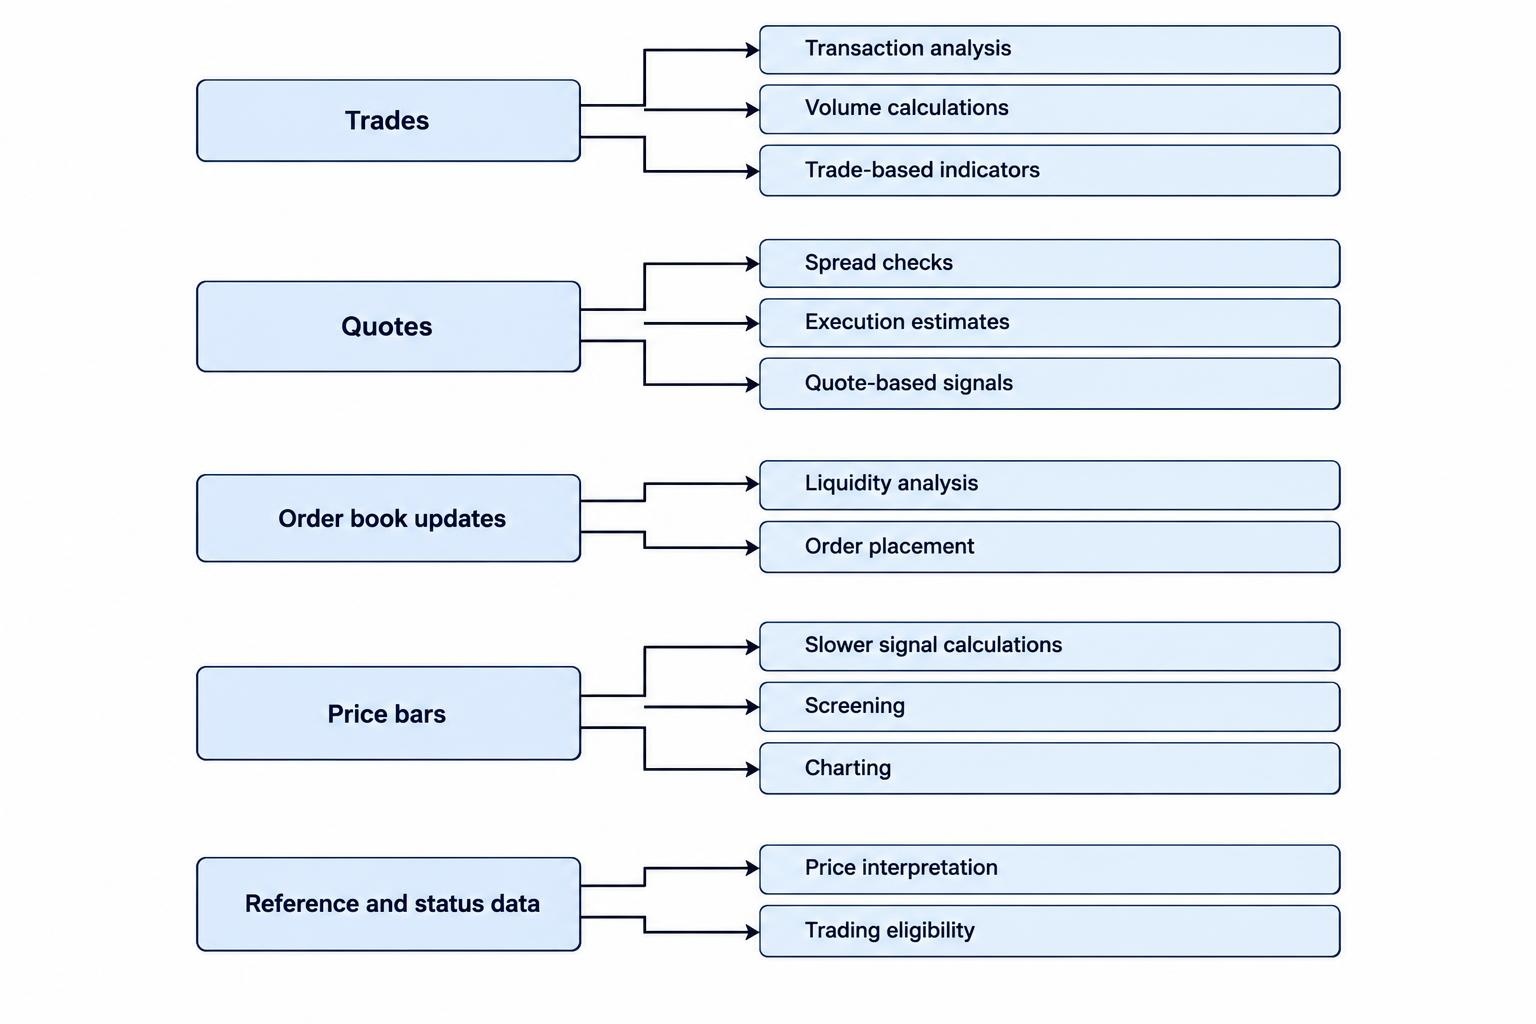
Write a minimum data specification before comparing subscriptions. Include the instruments, venues, sessions, fields, update frequency and maximum acceptable age. A daily portfolio strategy might need completed session prices and corporate action records. A system reacting to changing spreads needs current bid and ask updates instead.
Match Data Detail to the Decision
More detail brings more processing, storage and recovery work. Collecting every order book update serves little purpose if the strategy only evaluates completed hourly bars. Conversely, bars cannot recreate every event needed to test an execution-sensitive strategy.
Suppose a one-minute bar records a high of $101 and a low of $99. A strategy has a profit target at $100.80 and a stop at $99.20. That bar alone does not establish which threshold was reached first. A backtest that chooses the favorable sequence is making an assumption, not recovering missing evidence.
Top-of-book quotes and depth data also serve different purposes. The first describes the best displayed prices within the feed’s coverage; the second adds displayed interest beyond those prices. Neither promises that a submitted order will receive the displayed quantity. The guide to Level 1 versus Level 2 market data covers that choice in more detail.
Choose the simplest dataset that supports the actual decision, including its execution assumptions. Extra fields should earn their place through a clear use, rather than making the subscription invoice look more impressive.
Check Market Coverage Before Comparing Prices
A feed’s instrument list does not fully describe its coverage. A product may contain a stock symbol while showing activity from only one venue. Another may combine information from several venues. Comparing their prices or volumes without checking that distinction can produce false discrepancy alerts.
In U.S. equities, consolidated feeds combine reported activity across participating markets. For Network A and Network B securities, trades and quotes flow into central processing that produces the consolidated trade and quotation streams. The Consolidated Tape Association’s coverage overview describes this structure and the information its securities information processor distributes.
A direct venue feed answers a different question: what happened on that venue? Do not assume that “direct” means complete market coverage, or that “consolidated” means every product includes every available detail. Read the product specification rather than relying on the package name.
Ask the same coverage questions across asset classes. Which execution venues or contributors supply the prices? Does volume represent completed transactions, quote changes or something else? Are overnight sessions included? Document the answers so research and production systems use the same interpretation.
Separate Freshness, Latency and Timestamp Precision
Data freshness describes how old the information is when the strategy uses it. Latency describes delay along a defined path. Timestamp precision describes the granularity of a recorded time. These are related, but they are not substitutes.
A timestamp with many decimal places does not prove that a message arrived quickly. Store the feed’s event or publication timestamp, where available, alongside your own receipt time. Document the meaning, timezone and units of each field. Differences between timestamps can help measure delay only when their definitions and clock synchronization support the comparison.
Feed formats vary. Nasdaq TotalView-ITCH, for example, represents timestamps as nanoseconds since midnight and uses sequenced messages describing order and trade events. Those details are set out in the Nasdaq TotalView-ITCH technical specification. Your parser must follow the chosen feed’s rules, not assumptions borrowed from another API.
Set freshness thresholds around the decision horizon. A delay acceptable for a daily screen may invalidate a short-lived execution signal. The distinction between intentionally delayed subscriptions and live feeds is covered in real-time versus delayed market data.
Build a Data Pipeline You Can Inspect
A practical pipeline separates receiving, validating, normalizing, storing and consuming data. This separation makes failures easier to locate. If a signal changes unexpectedly, you should be able to determine whether the original message changed, the parser misread it or a calculation used the wrong field.
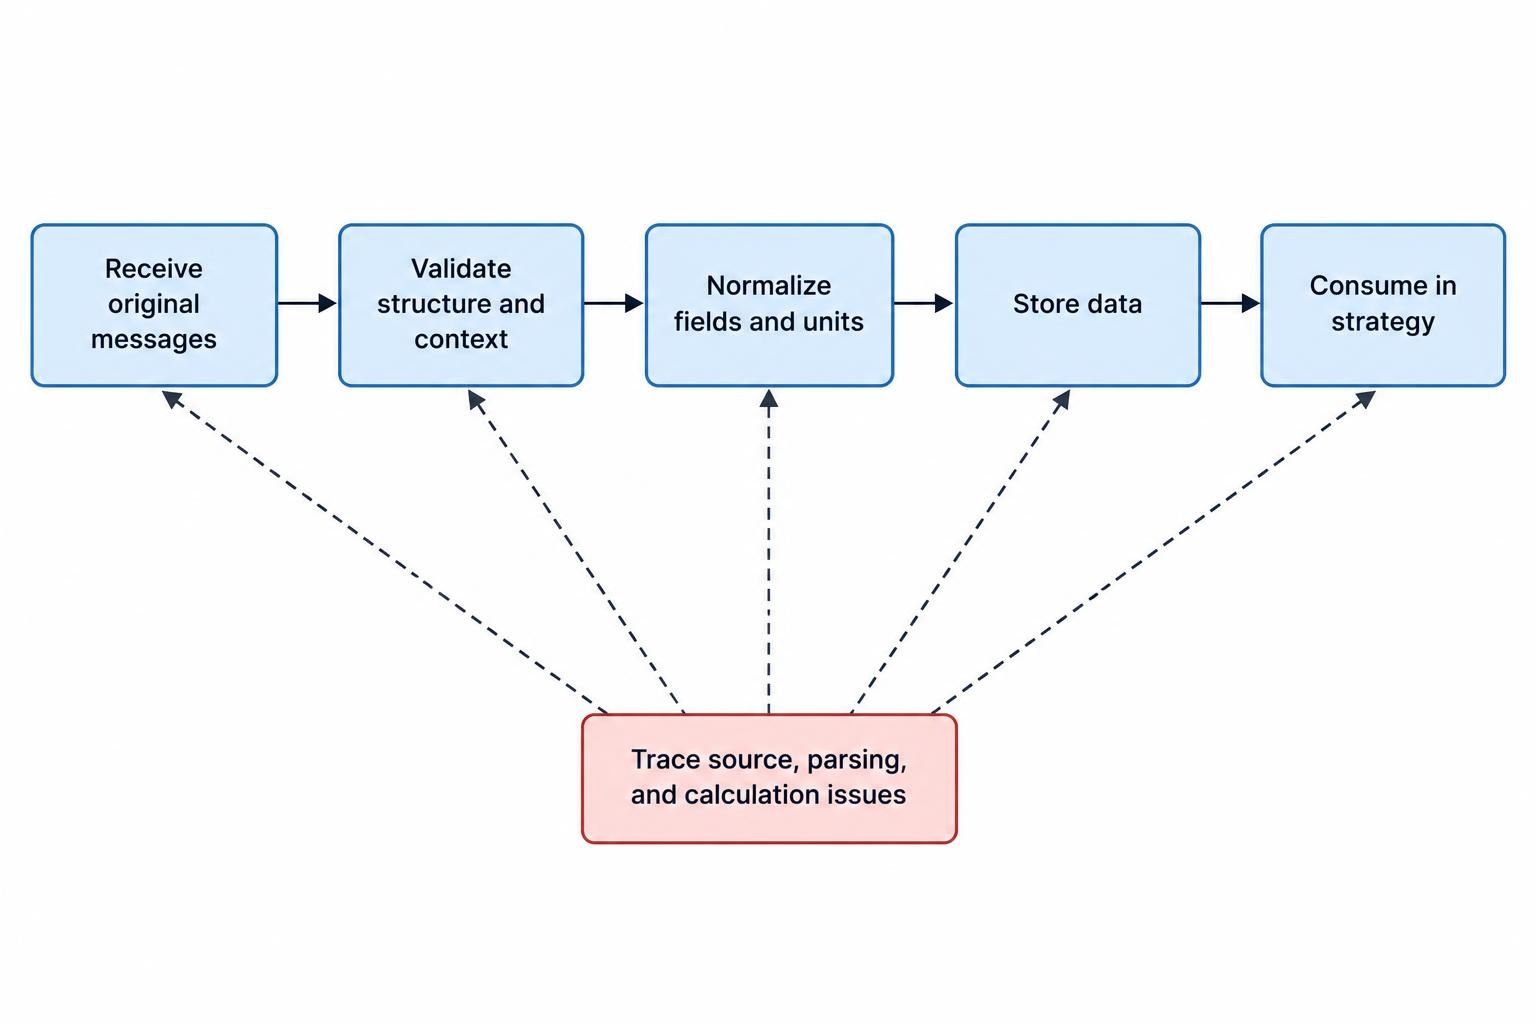
Preserve original messages where the license permits. Then create a normalized representation with consistent field names, identifiers and units. Keep the original values alongside transformed values when practical. Normalization should simplify consumption without erasing distinctions such as trade conditions, venue identifiers or quote status.
Use explicit price scales and quantity units. A quantity might represent shares, contracts or another defined unit. A symbol alone is not enough to identify a futures contract or options series; expiry and other contract attributes matter too.
Treat data reception and order submission as separate services, even if one provider supplies both. A working price connection does not establish that the execution connection is healthy. Likewise, an available order endpoint does not prove that the strategy’s market view is current. The broader connection design belongs in trading APIs and platform integrations.
Validate Meaning, Not Just Message Format
A message can be valid JSON or a correctly sized binary record and still be unsuitable for a trading decision. Validation should check both structure and context.
- Completeness: Identify missing intervals, required fields and sequence gaps where the protocol supports them.
- Consistency: Check identifiers, price scales, quantity units and session assignments.
- Timeliness: Flag stale observations, unexpected delays and local processing backlogs.
- Market state: Distinguish ordinary trading from auctions, pauses, halts and closed sessions.
Do not automatically delete every unusual price. A sharp move may be genuine, while a repeated unchanged price may reflect stale data. Quarantine questionable observations, retain the reason and define which checks can reject data automatically.
Cross-feed comparisons need care too. Before treating a disagreement as an error, align coverage, timestamps and transaction conditions. Two feeds can report different values because they describe different events. A comparison is useful only after those differences have been accounted for.
Keep Historical and Live Data Compatible
Historical data should support the same interpretation of events that the live strategy uses. Check session boundaries, bar construction, timezone handling, trade filters and adjustment policies. Otherwise, a strategy may change behavior during deployment even though its rules remain untouched.
Historical products differ in what they preserve. NYSE’s historical TAQ Integrated Feed, for example, includes order additions, modifications and deletions, trade events with corrections and cancellations, and security status information. That event history supports different analysis from a file containing only daily closing prices.
Preserve data availability times when testing decisions. A correction received later should not silently become information the simulated strategy “knew” earlier. Keep dataset versions and transformation settings so a research result can be reproduced after a vendor revises its files.
Also check the historical instrument universe. Testing only instruments that remain available today can exclude failed or delisted securities. For the acquisition and preparation process, use the guide to historical market data sources, quality and cleaning.
Plan for Gaps, Reconnects and Stale Prices
A connected socket is not proof of usable data. A system can remain connected while one instrument stops updating, a local queue grows or a subscription expires. Monitor feed health, instrument freshness and processing backlog separately.
For feeds that reconstruct a book from incremental updates, define how recovery works after missing messages. Depending on the protocol, recovery may require retransmission, a fresh snapshot or a combination of both. Follow the provider’s sequencing rules before marking the reconstructed state as usable again.
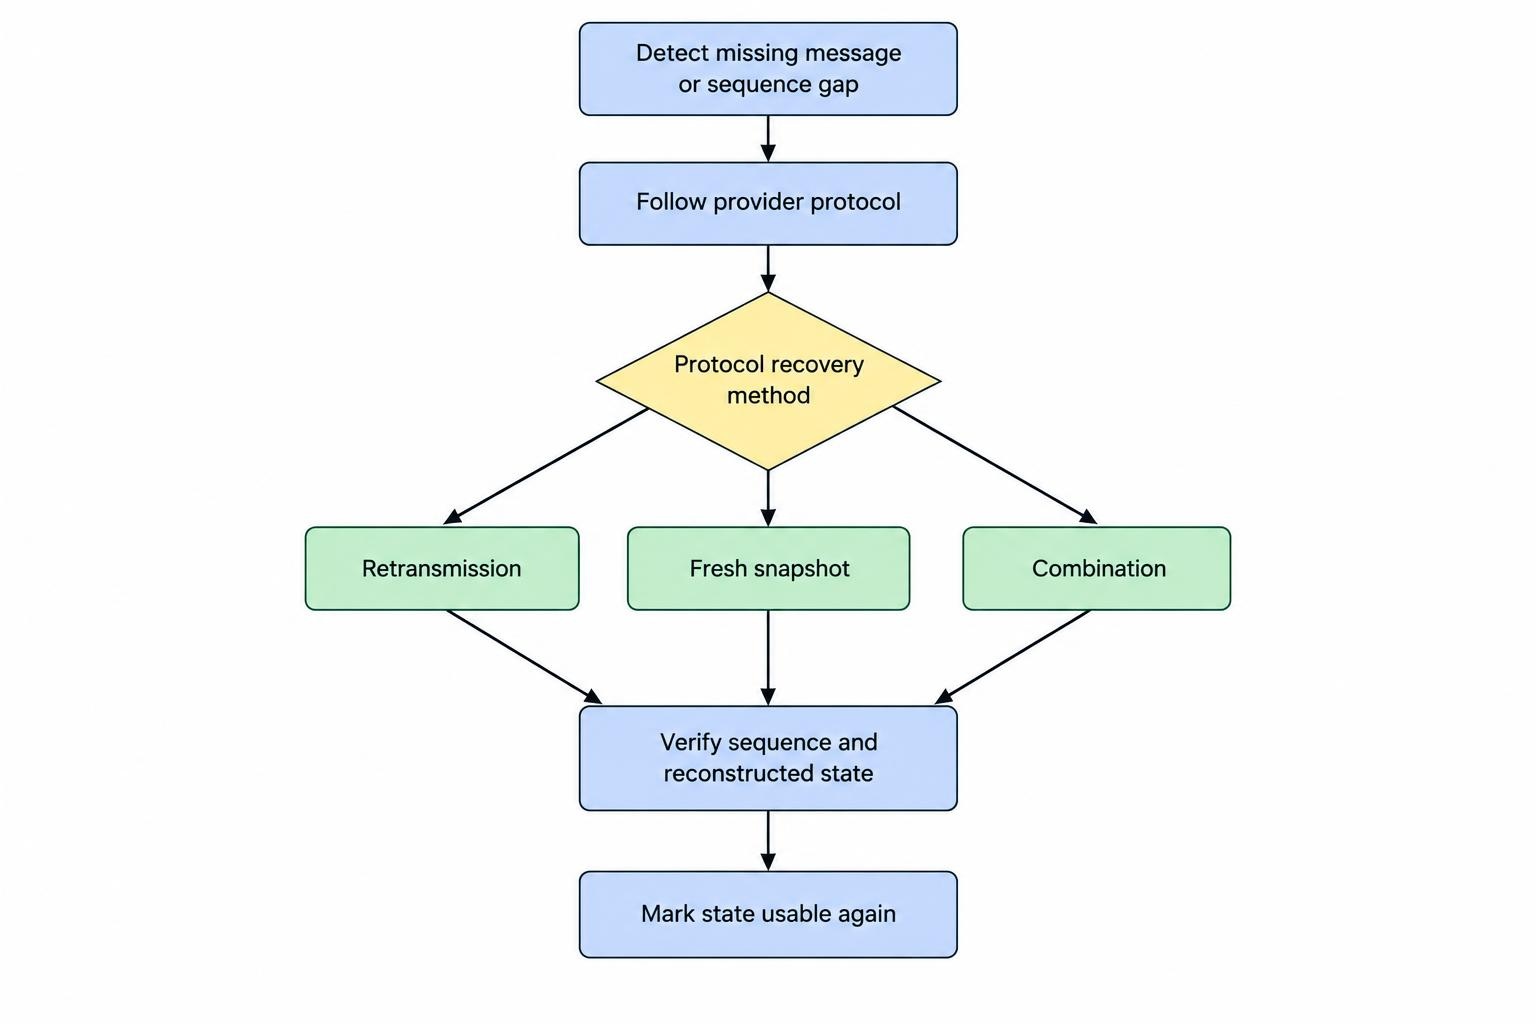
Separate the response to missing data from the response to market movement. An illustrative policy might block new entries when a required quote becomes stale, alert an operator and continue managing existing orders through the execution connection. Whether to cancel working orders needs its own assessment; cancellation is not automatically the safest response.
Test these behaviors deliberately. Disconnect the feed, restart the process and inject duplicates or out-of-order messages into a test environment. Recovery should be demonstrated before live trading, not improvised while positions remain open.
Budget for Usage Rights and Operating Costs
The subscription price is only part of the cost. Budget for exchange charges, connectivity, storage, historical downloads, monitoring and maintenance. Obtain a written description of what the quoted package permits, including automated processing and any downstream use.
Display access and automated use are not interchangeable licensing categories. CME Group’s non-display guidance includes automated trading, risk management, research and other machine-based uses, with requirements depending on the activity and subscriber arrangement. Check the CME Group non-display licensing guidelines before assuming that a chart subscription covers a trading application.
Document who and what can access each dataset. Include research services, production strategies, dashboards and external recipients. Review the inventory when systems change, not only when a subscription renews.
Access controls can also be contractual requirements. CME Group’s entitlement-system requirements call for controls over downstream access and records of entitlement activity. Treat permissions as part of the system design rather than paperwork added after deployment.
Choose a Feed Through a Controlled Trial
Evaluate candidate feeds against a written acceptance test using representative instruments and sessions. Include busy periods, quiet periods, session transitions and reconnects. Check field definitions, missing events, observed delay, historical consistency and recovery behavior.
Compare the resulting strategy decisions, not just the charts. Two datasets may look similar on screen yet trigger different entries because their bars close differently or their quote coverage differs. Investigate those differences before selecting either feed as the production input.
The right market data service is the one that meets the strategy’s documented requirements at a sustainable cost. Accept it only when the system can identify what it receives, explain how it processes that information and respond safely when the information becomes unreliable.