Historical market data records past prices, trades, quotes, volumes and other market events. Traders use it to test strategies, estimate trading costs and investigate how markets behaved under different conditions. Its value depends on what the records actually represent, not simply how many years fit in the download.
A daily closing price cannot tell you whether a stop order would have filled during a brief selloff. A trade record does not show the bid and offer available when an order arrived. Even two apparently identical price histories can differ because of session boundaries, corporate action adjustments or correction policies.
The practical task is to choose an appropriate source, check its coverage and clean it without rewriting the market’s history. Within a broader market data workflow for trading systems, historical data needs clear definitions and repeatable processing before it becomes useful research material.
Choose Historical Data That Matches the Research
Start with the decision the strategy makes. A monthly portfolio review and an intraday execution model need different evidence. Buying more detailed data does not automatically improve a study, but buying less detail than the strategy requires creates assumptions that no amount of spreadsheet work can repair.
| Data type | Useful for | What it cannot establish alone |
|---|---|---|
| Daily OHLCV bars | Longer holding periods, daily signals and portfolio research | The sequence of price movements within the session |
| Intraday bars | Time based signals and intraday volatility analysis | Exact trade ordering or executable quotes within each bar |
| Individual trades | Transaction activity and detailed price analysis | The spread and available quoted liquidity |
| Bid and offer quotes | Spread estimates and execution assumptions | Guaranteed fills or the full queue ahead of an order |
| Order book events | Depth reconstruction and queue related research | A guaranteed recreation of the strategy’s live execution |
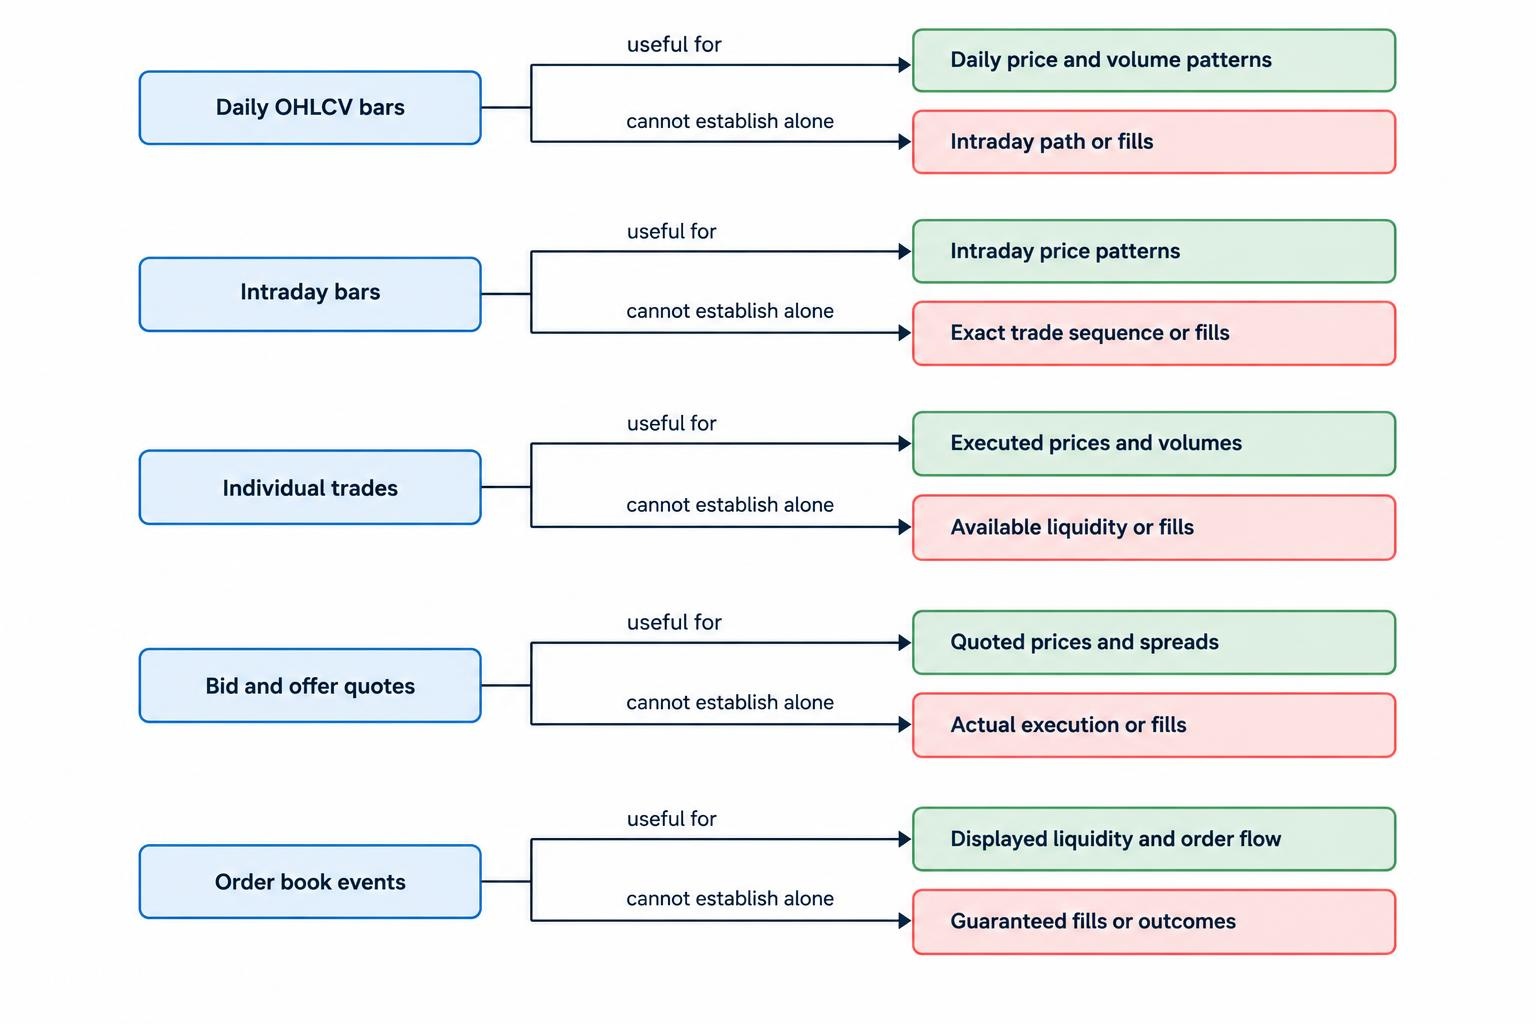
Write down the required instruments, dates, venues, sessions and fields before comparing providers. Also define the price basis: transaction price, quote midpoint, official close or settlement. These are not interchangeable labels for the same number.
Where to Find Historical Market Data
Exchange archives
Exchange archives provide a direct route to documented market records. For US equities, NYSE historical TAQ products include trades, quotes and order book information. The coverage depends on the product: an individual exchange feed and the broader Daily TAQ archive do not represent the same market view.
That distinction matters when comparing results. A strategy using activity from one venue should not treat that venue’s volume as total market volume. Check the product specification rather than relying on the exchange name in the file description.
Independent vendors and research databases
Independent vendors can simplify delivery through APIs, bulk files and consistent formats across markets. Research databases can add security histories, corporate actions and return calculations. Assess the processing behind those conveniences: what was filtered, what was adjusted, and what original information remains available?
Request a sample covering awkward periods, not just an ordinary trading week. Include a volatile session, a holiday boundary, a corporate action and an inactive security where relevant. A sample is useful for checking field definitions, missing records and whether the documentation answers practical questions.
Free downloads and platform exports
Free files and trading platform exports can support exploratory work. Before relying on them, establish whether they contain trades, quotes or provider constructed bars. Check download caps, timestamp precision, session settings and adjustment methods. Saving a file successfully proves that the download worked; it does not prove the dataset is complete.
Compare total project cost rather than subscription price alone. Cleaning, storage, instrument mapping and repeated downloads consume time. Review whether the proposed licence permits your intended storage, analysis, sharing and publication before committing to a source.
Check Coverage, Instrument Identity and Survivorship
A dataset should describe the securities that existed during the research period, not just those available now. Request inactive instruments, historical membership records where needed, and documented treatment of delistings. Otherwise, a test can exclude securities that failed or disappeared before the download date.
Ticker symbols are also poor permanent identifiers. Build a dated mapping between each security identifier and its symbols, listings and corporate events. CRSP US Stock Database documentation identifies active and inactive security coverage, permanent identifiers, corporate actions and delisting information as parts of its stock research data.
Keep the selection process historical too. If a strategy trades index members, reconstruct membership for each relevant date. If it screens by market value, use shares outstanding and prices available at the decision time. A historically accurate price series attached to today’s stock list still answers the wrong question.
Record coverage by instrument and period. A provider might have daily history throughout the requested range but detailed quotes only for later years. Do not let one broad “start date” conceal changes in usable detail.
Resolve Timestamps Before Combining Files
For every timestamp, establish what event it measures, its time zone and its precision. Event time, publication time and receipt time answer different questions. The Databento historical API field definitions, for example, distinguish an event timestamp from the time a capture server received the message. Those fields should not be substituted without considering the research purpose.
Use UTC for consistent storage where practical, while retaining the original timestamp and the exchange’s session date. Apply a dated trading calendar for holidays, early closes and daylight saving changes. An overnight session can span two calendar dates, so grouping records by UTC date alone may split a trading session incorrectly.
For bars, document whether the timestamp marks the start or end of the interval. A bar labelled 10:00 might describe the minute beginning at 10:00 or the minute ending then. When joining data, that difference can move information into a decision that occurred before the information existed.
At event level, retain sequence numbers and use documented ordering rules. Do not remove records simply because several share one timestamp. The timestamp may be less precise than the underlying event stream.
Clean Historical Data Without Erasing Real Events
Cleaning should identify errors, preserve evidence and apply documented transformations. It should not make every chart look tidy. A price jump can be a bad record, but it can also be the event the strategy needs to survive.
Separate missing records from inactive periods
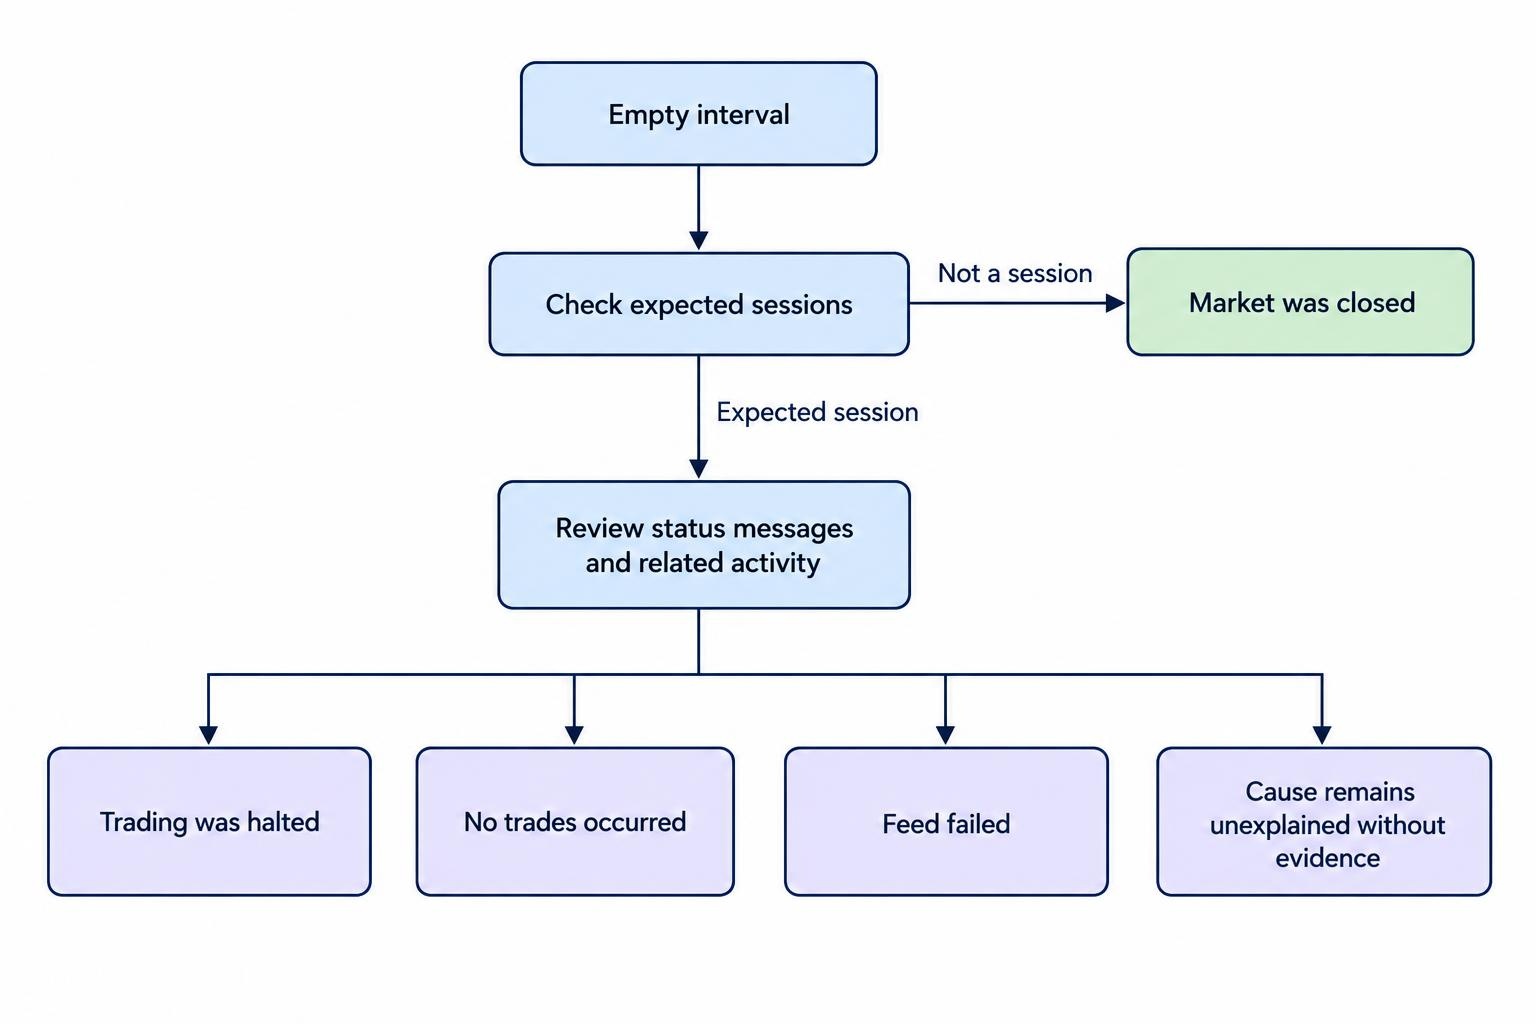
An empty interval can mean no trades occurred, the market was closed, trading was halted or the feed failed. Treat those cases separately. Compare expected sessions with observed records, inspect status messages where available, and use related activity to investigate unexplained gaps.
Forward filling may be acceptable for a valuation series, subject to a stated age limit. It is not evidence of a fresh executable quote. If an analysis carries a price forward, preserve the original observation time and mark the value as carried forward. Never invent volume to fill a blank interval.
Detect duplicates using record identity
Two trades can share a price, size and timestamp without being duplicates. Prefer documented trade identifiers, message identifiers or sequence information when checking repeated records. Scope those identifiers to the venue, channel or session required by the specification.
Apply feed corrections rather than treating every message as another trade. Nasdaq Last Sale technical specifications define cancellation and correction messages, alongside sale condition rules that affect high, low, last sale and volume calculations. Preserve those conditions when building your own bars.
Flag suspicious values before removing them
Check bar consistency: the high should not be below the low, and eligible opening and closing prices should sit within the reported range. Investigate unexpected price scales, impossible sizes and sudden changes in decimal precision.
Use instrument aware rules. Rejecting every negative price is not an appropriate universal check across financial instruments. A crossed quote also deserves investigation into timing, venue scope and feed construction before automatic removal.
For each suspect observation, retain the raw record, the reason for the flag and the action taken. Quarantining a questionable record makes the decision reviewable. Silently deleting it leaves the next researcher guessing.
Handle Adjustments and Derivative Contracts Explicitly
Keep raw equity prices separate from adjusted research series. Split adjustments and dividend related adjustments serve different purposes, and provider definitions can differ. Store the factors and methodology used rather than keeping only the final adjusted column. The detailed calculations belong in adjusting historical prices for stock splits and dividends.
For a simple illustration, a two for one split can move a share price from about $100 to about $50 without halving the shareholder’s economic position. A raw return calculation across that boundary would misread the event. Yet an adjusted historical price should not be presented as the price at which an order actually traded.
Keep execution prices, position changes and cash distributions consistent. Mixing adjusted closes with raw opening prices can produce returns that belong to neither series.
Futures and options need contract level records
For derivatives, request contract definitions as well as prices. CME Group futures and options data covers market statistics through order book detail and provides historical access routes. Select the dataset that matches the intended calculation, rather than assuming any futures history is suitable.
A continuous futures series is a constructed history, not a single contract that traded throughout the period. Document its rollover rule and any price adjustment. Use actual contract records when modelling contract selection, fills and rollover transactions.
For options, retain expiry, strike, option type, multiplier and relevant contract adjustments. Keep settlement prices distinct from transaction prices, and identify whether volatility or other analytical fields were supplied or calculated. Recomputing a field later with different assumptions can change the dataset without changing its original price records.
Keep the Cleaning Process Reproducible
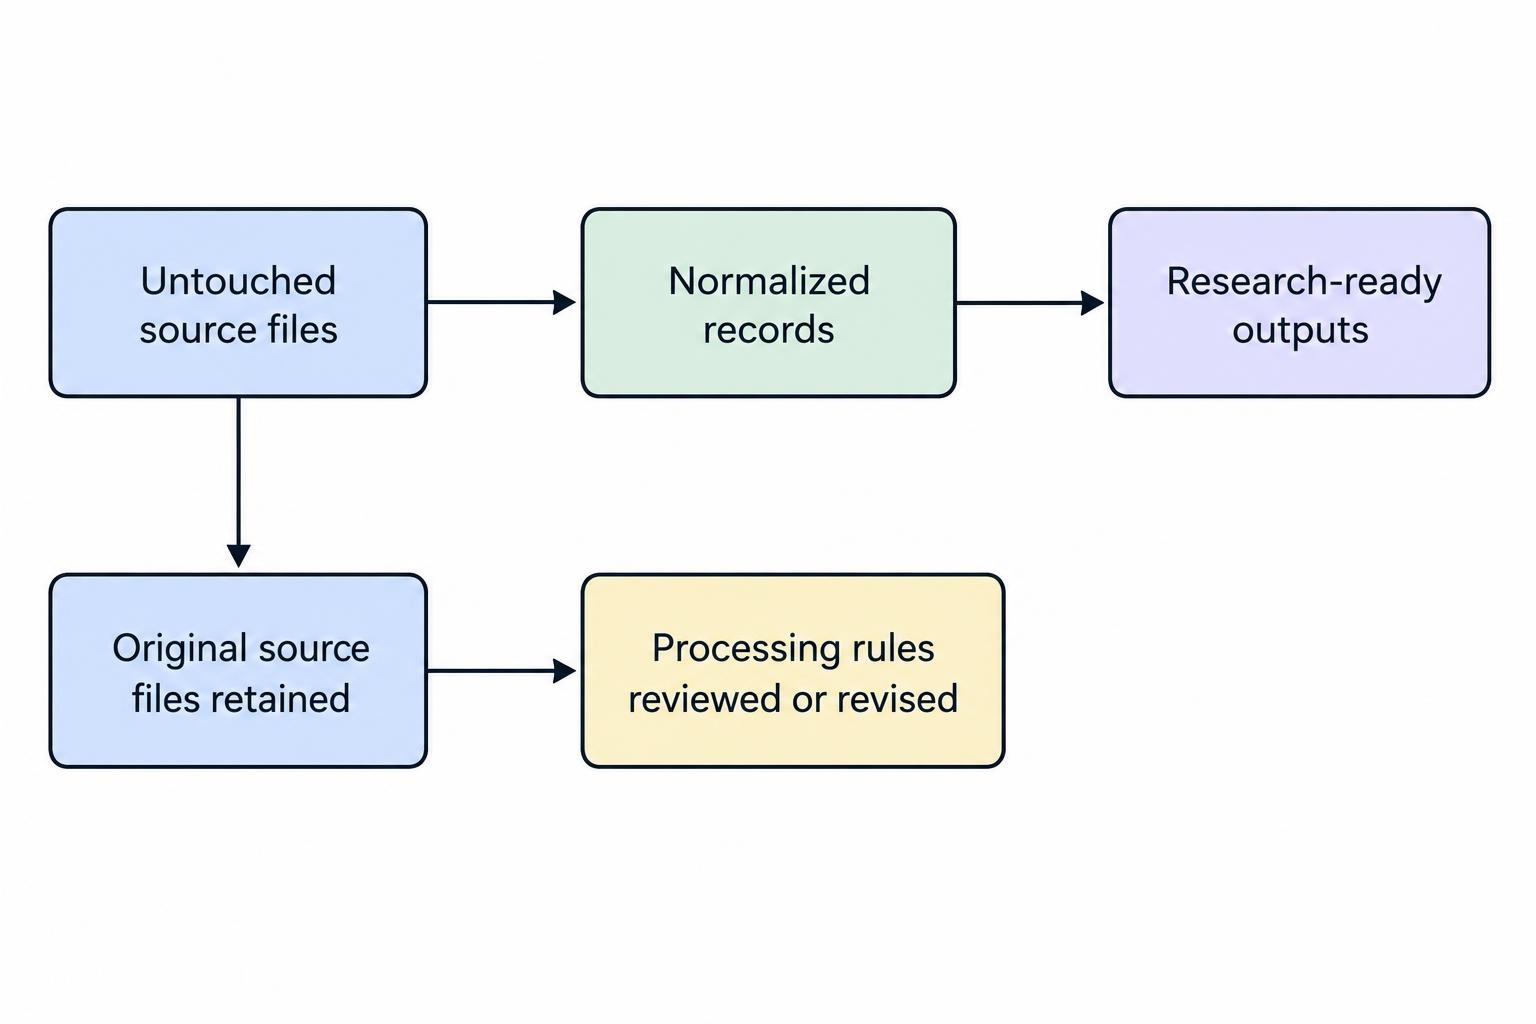
Maintain three layers: untouched source files, normalized records and research ready outputs. Never overwrite the original download with a cleaned version. That separation lets you revise a rule without losing the evidence needed to check it.
Each dataset release should have a short manifest covering its provider, product, retrieval date, requested coverage, schema version, time conventions and processing version. Add file checksums and counts before and after cleaning. For transformed fields, retain enough detail to reproduce the result.
A compact quality report should track missing sessions, duplicate identifiers, quarantined observations, unmapped instruments and unresolved corrections. Break those checks down by date and instrument. A single average completeness score can hide a missing session in the exact period being studied.
When comparing providers, align definitions before comparing numbers. Match venue coverage, sessions, adjustment basis and trade eligibility. Differences in those settings can explain a price or volume mismatch without either file being corrupt.
Approve the Dataset Before Testing the Strategy
Set acceptance criteria before reviewing strategy performance. Require documented session boundaries, resolved instrument mappings and an explicit treatment for gaps and corrections. Tighten the requirements where the strategy depends on event timing or quoted liquidity.
Data quality and backtest validity are related, but they are not the same job. A perfectly parsed file can still contain information unavailable at the simulated decision time. Address that separate risk through checks for look-ahead bias and overfitting, rather than expecting data cleaning to solve it.
Finally, freeze the approved dataset version for each research run. If the provider revises its archive or a cleaning rule changes, create a new release and compare the affected results. Historical data should make a trading decision easier to audit, not harder to explain.