The binary options break-even win rate is the percentage of trades you must win to cover your losses and trading costs. For a contract that pays 80% net profit on a winner and loses the entire stake on a loser, the threshold is 55.56% before fees. Winning half your trades would lose money.
The calculation depends on what “payout” means, how much a losing trade costs, and whether fees or refunds apply. A quoted return alone cannot tell you whether a strategy is profitable. This guide works through the formulas using hypothetical figures, then shows how to compare the result with a trading record.
The Binary Options Break-Even Formula
For trades with two possible financial outcomes, use:
Break-even win rate = loss per losing trade ÷ (profit per winning trade + loss per losing trade)
Use net profit and net loss, not the total cash returned after settlement. Express both amounts as positive numbers in the formula, then multiply the answer by 100 to get a percentage.
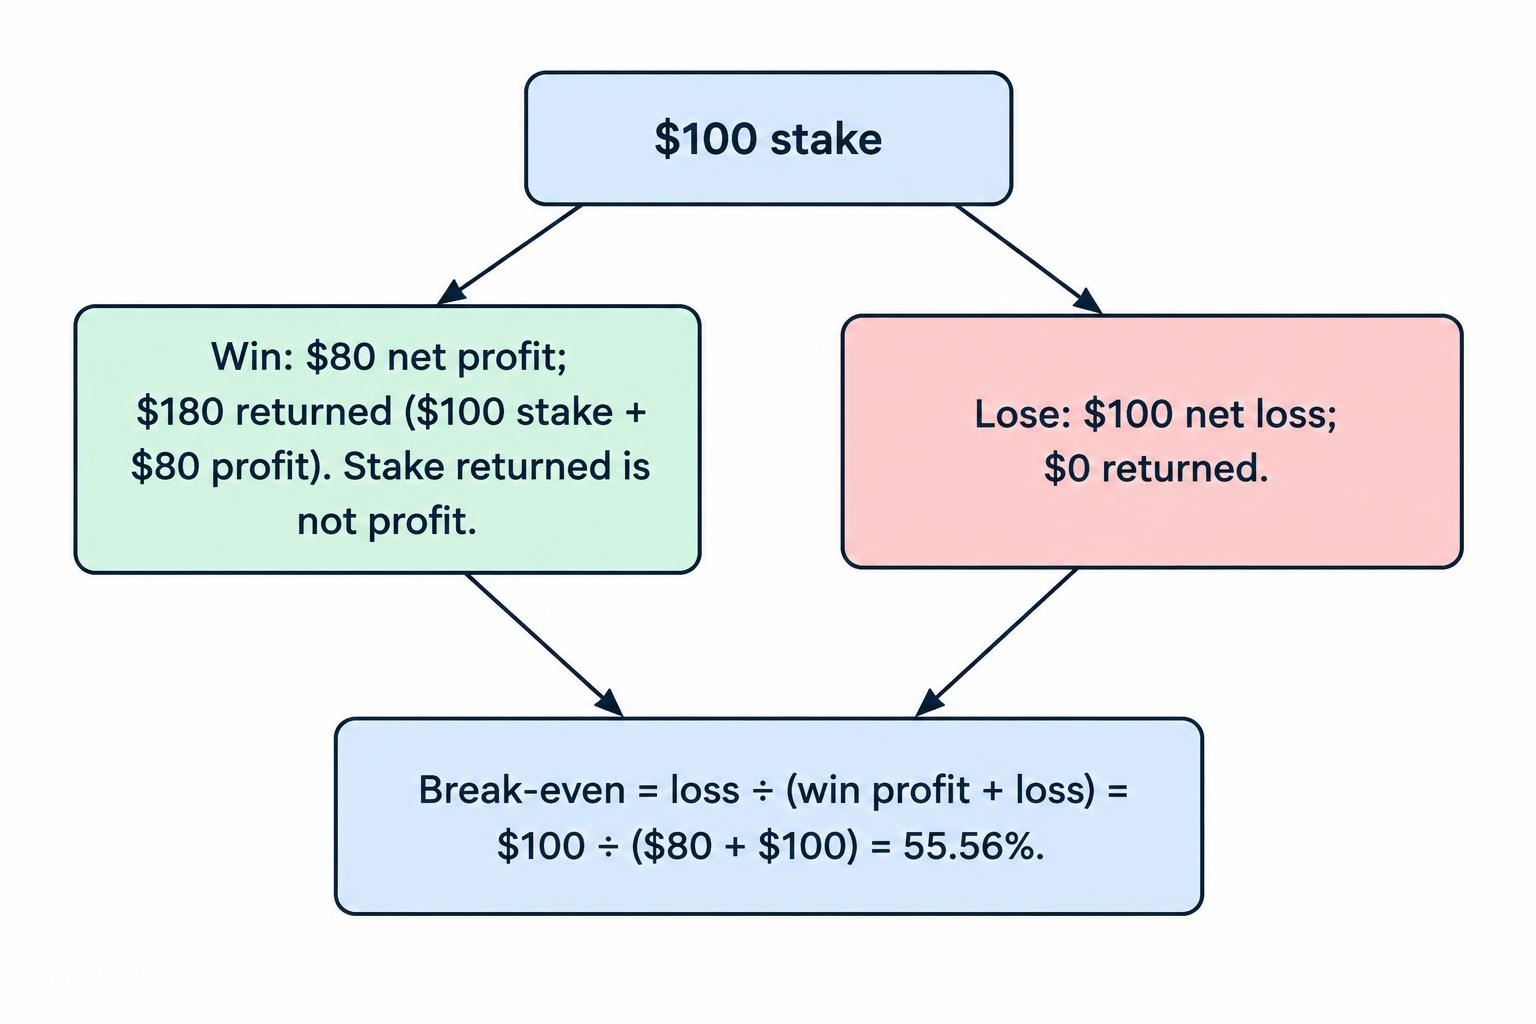
Suppose each trade risks $100. A winning trade earns $80 profit, while a losing trade loses $100:
Break-even win rate = $100 ÷ ($80 + $100) = 55.555…%
At exactly that threshold, expected profit is zero before any costs not already included. To have positive expected profit, the true win probability must exceed it. Rounding the result to 55.56% is useful for display, but keep the unrounded figure in calculations.
For contracts with a full stake loss and no fees, the shorter formula is:
Break-even win rate = 1 ÷ (1 + payout rate)
Enter an 80% profit payout as 0.80, not 80. The distinction between profit, returned stake and charges is covered further in binary options payouts and trading costs.
What Does an 80% Payout Actually Mean?
In the examples here, an 80% payout means an $80 profit on a $100 stake. A successful settlement returns $180: the original $100 plus $80 profit. A failed settlement returns nothing, producing a $100 loss.
Do not enter $180 as the winning profit. Doing so would produce a false break-even rate of 35.71%, because it counts your returned capital as earnings. Getting your own money back is not a trading edge.
Check the contract’s monetary outcomes rather than relying on a percentage label. If an amount described as a “return” includes the stake, subtract that stake before calculating profit. Also check whether the amount shown includes fees.
The imbalance between a smaller winning profit and a larger losing amount is a documented risk. The joint CFTC and SEC binary options alert illustrates how a 50% winning return against a full stake loss creates negative expected returns when the chance of winning is 50%.
Break-Even Win Rates at Different Payouts
The table assumes equal stakes, no fees, no refunds and a complete stake loss on every losing trade. These are mathematical examples, not available offers or estimates of achievable performance.
| Net profit payout | Profit on a $100 winner | Break-even win rate | Minimum wins for profit over 100 trades |
|---|---|---|---|
| 50% | $50 | 66.67% | 67 |
| 60% | $60 | 62.50% | 63 |
| 70% | $70 | 58.82% | 59 |
| 75% | $75 | 57.14% | 58 |
| 80% | $80 | 55.56% | 56 |
| 85% | $85 | 54.05% | 55 |
| 90% | $90 | 52.63% | 53 |
| 95% | $95 | 51.28% | 52 |
| 100% | $100 | 50.00% | 51 |
The final column requires strictly positive profit. At a 100% payout, 50 wins and 50 losses break even; 51 wins produce a profit. At an 80% payout, 56 wins earn $4,480 while 44 losses cost $4,400, leaving $80.
A higher payout lowers the required win rate, but that does not make the contract easier to trade profitably. The probability of a successful outcome still matters.
Use Expected Value to Check the Result
The break-even rate gives you a threshold. Expected value shows the average gain or loss per trade under an assumed win probability:
Expected profit = (win probability × winning profit) − (loss probability × losing amount)
With an 80% payout, $100 stakes and an assumed 60% win probability:
Expected profit = (0.60 × $80) − (0.40 × $100) = $8 per trade
That is an expected return of 8% of the stake per trade under those assumptions. It is not an 8% return on the account, nor a promise that the next trade or next hundred trades will deliver that average.
Reduce the assumed win probability to 55%, and the calculation changes to $44 − $45 = a $1 expected loss per trade. A strategy can win more often than it loses and still lose money.
Adjusting the Formula for Fees and Refunds
Fees charged on every trade
Suppose a hypothetical contract risks $100, pays $80 profit on a winner, and charges a separate $2 fee on every trade. The net winning profit becomes $78. The net losing amount becomes $102.
Break-even win rate = $102 ÷ ($78 + $102) = 56.67%
A convenient formula for a constant fee is:
Break-even win rate = (1 + fee as a fraction of stake) ÷ (1 + payout rate)
This assumes the fee is charged separately, is identical on winners and losers, and the entire stake is lost on a losing trade. If charges differ by outcome, calculate each outcome’s net cash result and use the general formula instead.
A partial refund on losing trades
Now assume an 80% profit payout and a genuine, unrestricted 10% cash refund on losing stakes, with no fees. A $100 winner earns $80; a loser costs $90:
Break-even win rate = $90 ÷ ($80 + $90) = 52.94%
Do not treat promotional credit as cash unless its terms allow it to function as cash. A refund tied to further trading or withdrawal conditions does not necessarily reduce the economic loss by its advertised amount.
For recurring research or subscription expenses, separate trading break-even from business break-even. A system that covers contract losses but not its operating expenses is still losing money.
Contracts Quoted at a Price Rather Than a Payout Percentage
The same arithmetic works for a hypothetical contract purchased at a price and settled at either a fixed value or zero. Consider buying a contract for $62 that pays $100 if successful and zero otherwise.
The winning profit is $38, not $100. The losing amount is $62:
Break-even win rate = $62 ÷ ($38 + $62) = 62%
Without fees, a purchased contract’s break-even probability is its purchase price divided by its successful settlement value. Use the executable purchase price, rather than a midpoint you could not actually trade.
This example assumes the position is held to settlement. Early exits introduce different realized gains and losses, so the original two-outcome calculation may no longer describe the strategy. Contract mechanics belong alongside the calculation; see binary options pricing, expiry and settlement.
Changing Payouts and Stakes Can Make Win Rate Misleading
A single threshold works cleanly when every trade has the same payoff structure. If payouts vary, record the payout attached to each trade rather than applying the highest advertised rate to the entire history.
Suppose 100 hypothetical trades use $100 stakes. Fifty trades offer an 80% profit payout and fifty offer 60%. Assume the first group contains 40 winners and the second contains 20 winners.
The total win rate is 60%, but profit must be calculated from the actual outcomes: 40 × $80 plus 20 × $60, minus 40 × $100. That produces $400 profit. Applying the simple average payout of 70% to all 60 winners would produce only $200 profit, an inaccurate reconstruction.
The difference arises because wins were more frequent in the higher payout group. An average offered payout can hide that relationship. For a completed trading record, calculate cash profit directly. For forecasting, assess win probabilities and payoffs within comparable groups.
Unequal stakes create another problem. Nine $10 winners at an 80% payout earn $72. One $100 loser costs $100. The win rate is 90%, yet the net result is a $28 loss.
A useful trading journal and performance record should therefore track stakes, net winning profits, net losses and charges, not just a green or red result.
How to Handle Ties and Voided Trades
If a tie returns the full stake without any charge, it contributes zero profit or loss. You can exclude it from the decisive-trade win rate: wins divided by wins plus losses.
Suppose there are 60 wins, 35 losses and five fully refunded ties. The decisive win rate is 60 ÷ 95 = 63.16%. Reporting 60% across all attempts is a different measure. Label the denominator so you do not compare one measure with a threshold calculated for another.
If ties incur charges, they are not financially neutral. Either retain them as a separate outcome or include their cost explicitly. The general expected-profit calculation must account for every outcome with a financial effect.
A Recorded Win Rate Is Not a Proven Win Probability
A trading record estimates performance; it does not establish the true probability of winning. Sixty wins from 100 trades gives an observed 60% win rate, but that estimate has substantial uncertainty.
Using the NIST Wilson confidence interval method, the approximate two-sided 95% interval for 60 wins from 100 independent trials is 50.2% to 69.1%. This calculation assumes a stable win probability and comparable, independent trials. The interval includes values below the 55.56% break-even threshold for an 80% payout.
That sample therefore does not establish that the true win probability exceeds break-even at the stated confidence level. Trades sharing the same market event may also be dependent, making a simple independent-trial calculation inappropriate.
Freeze the strategy rules before evaluating a fresh sample. Repeatedly changing the rules until the historical win rate looks attractive tests your ability to fit past results, not necessarily your ability to predict new ones.
Keep simulated and funded results separate too. The comparison in binary options demo accounts versus live trading helps frame that distinction. Neither a simulated winning streak nor a short funded record guarantees future profitability.
Increasing the Stake Does Not Lower Break-Even
With unchanged payout terms, doubling the stake doubles both possible profit and possible loss. It does not change the required win probability.
At an 80% payout, losing $100 and then winning a doubled $200 stake produces $160 profit on the second trade, leaving $60 across the pair. But another loss instead leaves a $300 cumulative loss. The recovery attempt changes the money at risk, not the underlying odds.
If each trade has negative expected value per dollar staked, increasing exposure after losses does not reverse that sign. A staking progression cannot repair an unfavorable payoff and win-probability combination.
Check Whether the Calculation Describes a Trade You Should Consider
Before comparing a strategy with break-even, write down the exact winning profit, losing amount, fees, tie treatment and settlement conditions. Recalculate whenever those terms change. Keep a margin between an estimated win rate and the threshold; a tiny apparent advantage is vulnerable to estimation errors and extra costs.
The arithmetic also assumes that quoted terms are honored and funds remain accessible. The SEC’s binary options fraud warning documents complaints involving blocked withdrawals and software manipulation, and advises investors to verify firms’ registration before committing money.
Check binary options platform registration and availability for the jurisdiction involved. A mathematically attractive payoff does not establish that an offer is lawful, genuine or suitable.
The practical test is straightforward: calculate break-even from net cash outcomes, compare it with an honestly evaluated trading record, and account for uncertainty. A high win rate is only useful when the money earned on winners exceeds the money lost on losers and all related costs.